

Previsioni di volatilità settimanale su S&P 500
Il Gandalf Volatility Forecaster segnala una nuova e più ampia normalizzazione della volatilità prevista. Sui 99 titoli presenti in entrambe le rilevazioni, la quota nelle classi 3–4 scende dal 64,6% al 48,5%, portandosi per la prima volta in questa sequenza sotto la metà del campione comparabile.
L’analisi rappresenta un’estrazione dei 100 titoli a maggiore capitalizzazione dell’S&P 500. I risultati descrivono questo campione selezionato e non la totalità dei componenti dell’indice.
Il modello assegna a ciascun titolo la classe di volatilità più probabile su una scala da 0 a 4: molto bassa, bassa, normale, alta e molto alta. La percentuale nelle heatmap misura la confidenza relativa della classificazione scelta, non la probabilità di rialzo o ribasso del prezzo.
Contesto generale: la normalizzazione si estende
Sull’intero paniere di 100 titoli, le classi 3–4 passano complessivamente da 64 a 49 componenti. La riduzione si concentra nella classe 3, che scende da 41 a 27 titoli, mentre la classe 4 rimane quasi stabile, da 23 a 22. Parallelamente, la classe 0 sale da 7 a 12 titoli, la classe 1 da 21 a 27 e la classe 2 da 8 a 12.
Il quadro suggerisce quindi un mercato meno uniformemente esposto alla volatilità elevata, ma ancora caratterizzato da nuclei persistenti di rischio. La componente molto alta non si riduce in misura paragonabile alla classe 3: la normalizzazione riguarda soprattutto titoli che abbandonano la fascia alta, mentre il gruppo più estremo resta concentrato in specifiche aree del mercato.
| Classe | Definizione | 9 agosto | 16 agosto |
|---|---|---|---|
| 0 | Molto bassa | 7% | 12% |
| 1 | Bassa | 21% | 27% |
| 2 | Normale | 8% | 12% |
| 3 | Alta | 41% | 27% |
| 4 | Molto alta | 23% | 22% |
Distribuzione dei titoli per classe
L’istogramma evidenzia la contrazione della classe 3 e l’ampliamento delle fasce 0–2. Arancione indica la rilevazione precedente; verde quella corrente.
Molto bassa
Bassa
Normale
Alta
Molto alta
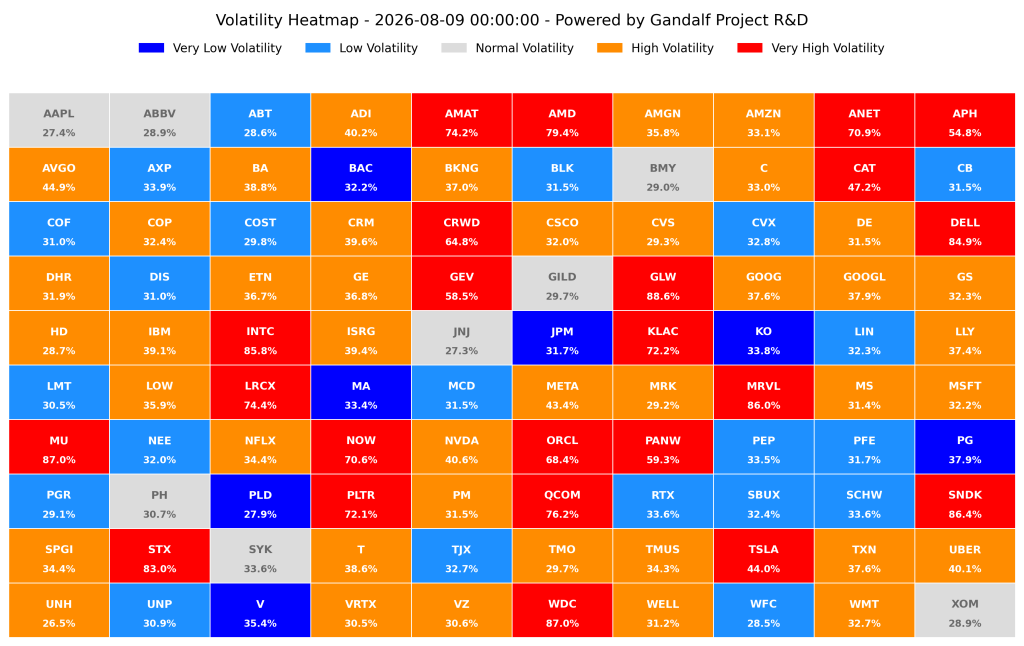
Previsione elaborata il 9 agosto 2026.
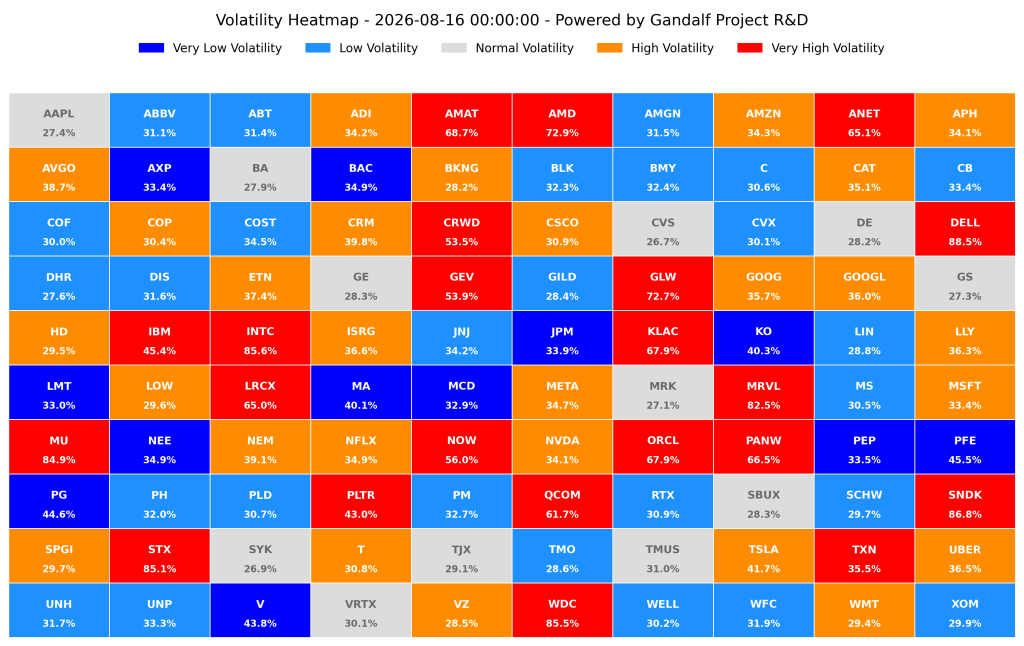
Previsione elaborata il 16 agosto 2026.
Dinamiche settoriali
Health Care: la normalizzazione più marcata
Nel paniere analizzato, l’Health Care comprende 16 titoli comparabili e registra il movimento settoriale più netto. La classe media scende da 2,44 a 1,44 e la quota nelle classi 3–4 dal 56,3% al 12,5%. Amgen, Thermo Fisher Scientific, UnitedHealth e Danaher passano dalla classe 3 alla classe 1; MRK e Vertex scendono dalla classe 3 alla 2. Il settore passa così da una presenza diffusa nelle fasce elevate a un profilo prevalentemente basso o normale.
Industrials e Financials: arretramento delle classi alte
Tra gli 11 Industriali comparabili, la quota nelle classi 3–4 diminuisce dal 63,6% al 36,4% e la classe media da 2,55 a 2,00. Boeing e GE scendono dalla classe 3 alla 2, mentre Lockheed Martin passa dalla classe 1 alla 0. Restano tuttavia segnali molto elevati su GEV e GLW.
Nei Financials, 14 titoli comparabili, la quota nelle fasce alte passa dal 28,6% al 7,1%. Citigroup e Morgan Stanley scendono dalla classe 3 alla 1; Goldman Sachs arretra dalla 3 alla 2. La classe media settoriale diminuisce da 1,29 a 0,86, indicando un profilo complessivamente più contenuto.
Consumer Staples: ulteriore raffreddamento
Nei Consumer Staples, sei titoli, la classe media passa da 1,33 a 0,83. Philip Morris scende dalla classe 3 alla 1, mentre Procter & Gamble e Coca-Cola restano in classe 0. La quota settoriale nelle classi 3–4 si dimezza dal 33,3% al 16,7%.
Tecnologia: il nucleo di volatilità elevata persiste
L’Information Technology rappresenta l’eccezione principale alla normalizzazione generale. Tra 29 titoli comparabili, la classe media resta sostanzialmente stabile, da 3,66 a 3,69, e il 96,6% dei componenti rimane nelle classi 3–4. AMAT, AMD, ANET, CRWD, DELL, GLW, INTC, KLAC, LRCX, MRVL, MU, NOW, ORCL, PANW, QCOM, SNDK, STX e WDC continuano a concentrare segnali molto elevati.
Communication Services e Consumer Discretionary: pressione ancora diffusa
Nei Communication Services, otto titoli comparabili, la quota nelle classi 3–4 scende soltanto dall’87,5% al 75,0%. Nel Consumer Discretionary, otto titoli, resta invariata al 62,5%. La riduzione della confidenza media nelle classi alte non modifica quindi in modo sostanziale il regime di questi due gruppi.
Le variazioni più significative
Il modello rileva otto diminuzioni di due classi e nessun aumento di pari entità:
- PM: classe 3 → 1; confidenza corrente 32,7%.
- AMGN: classe 3 → 1; confidenza corrente 31,5%.
- TMO: classe 3 → 1; confidenza corrente 28,6%.
- UNH: classe 3 → 1; confidenza corrente 31,7%.
- C: classe 3 → 1; confidenza corrente 30,6%.
- MS: classe 3 → 1; confidenza corrente 30,5%.
- WELL: classe 3 → 1; confidenza corrente 30,2%.
- DHR: classe 3 → 1; confidenza corrente 27,6%.
Complessivamente, 16 titoli escono dalle classi 3–4 e nessun titolo vi entra. Oltre agli otto movimenti principali, BA, GE, GS, CVS, DE, TMUS, VRTX e MRK passano dalla classe 3 alla 2. La composizione del paniere cambia marginalmente: NEM entra nella rilevazione corrente, mentre PGR era presente soltanto in quella precedente; i due titoli non sono inclusi nei confronti individuali.
Indicazioni per la gestione del rischio
La discesa sotto il 50% dei titoli comparabili nelle classi 3–4 suggerisce una riduzione della pressione aggregata. Il segnale non è però omogeneo: l’alta concentrazione nella tecnologia e la persistenza nei Communication Services richiedono ancora attenzione alle esposizioni settoriali e alle correlazioni.
Le previsioni possono supportare il monitoraggio del rischio, il dimensionamento delle posizioni e la valutazione delle coperture. Devono essere integrate con liquidità, orizzonte temporale, correlazioni e obiettivi dell’investitore.
Buona settimana
Gandalf Project R&D Team
Avvertenza importante — Non è consulenza finanziaria
Le informazioni contenute nel report sono fornite esclusivamente a scopo educativo e informativo. Non costituiscono una sollecitazione al pubblico risparmio, una raccomandazione di investimento o un’offerta di acquisto o vendita di strumenti finanziari. Gandalf Project non si assume responsabilità per decisioni di investimento prese sulla base del report; gli investitori devono svolgere valutazioni autonome e, se necessario, consultare un consulente finanziario qualificato.
Weekly Volatility Forecast for the S&P 500
The Gandalf Volatility Forecaster points to a further and broader normalisation in forecast volatility. Among the 99 stocks included in both model runs, the share assigned to classes 3–4 falls from 64.6% to 48.5%, moving below half of the comparable sample for the first time in this sequence.
The analysis is based on a selection of the 100 largest S&P 500 constituents by market capitalisation. The results describe this selected sample rather than the index’s full constituent universe.
The model assigns each stock its most likely volatility class on a scale from 0 to 4: very low, low, normal, high and very high. The percentage displayed in the heatmaps measures relative confidence in the selected classification; it is not the probability of a price increase or decrease.
General context: normalisation broadens
Across the full 100-stock universe, classes 3–4 decline from a combined 64 to 49 constituents. The reduction is concentrated in class 3, which falls from 41 to 27 stocks, while class 4 remains almost unchanged at 23 versus 22. At the same time, class 0 rises from 7 to 12 stocks, class 1 from 21 to 27 and class 2 from 8 to 12.
The picture therefore suggests a market that is less uniformly exposed to elevated volatility, but still characterised by persistent risk clusters. The very-high class does not contract to the same degree as class 3: normalisation mainly concerns stocks leaving the high band, while the most extreme group remains concentrated in specific market segments.
| Class | Definition | August 9 | August 16 |
|---|---|---|---|
| 0 | Very low | 7% | 12% |
| 1 | Low | 21% | 27% |
| 2 | Normal | 8% | 12% |
| 3 | High | 41% | 27% |
| 4 | Very high | 23% | 22% |
Distribution of stocks by class
The histogram highlights the contraction in class 3 and the expansion of classes 0–2. Orange represents the previous run and green the current run.
Very low
Low
Normal
High
Very high
Forecast generated on August 9, 2026.
Forecast generated on August 16, 2026.
Sector dynamics
Health Care: the strongest normalisation
Health Care includes 16 comparable stocks and records the clearest sector shift. Its average class declines from 2.44 to 1.44 and its share in classes 3–4 from 56.3% to 12.5%. Amgen, Thermo Fisher Scientific, UnitedHealth and Danaher move from class 3 to class 1; MRK and Vertex fall from class 3 to class 2. The sector therefore moves from broad upper-band representation to a predominantly low or normal profile.
Industrials and Financials: upper classes retreat
Among 11 comparable Industrials, the share in classes 3–4 declines from 63.6% to 36.4% and the average class from 2.55 to 2.00. Boeing and GE move from class 3 to class 2, while Lockheed Martin moves from class 1 to class 0. GEV and GLW nevertheless retain very-high signals.
Among 14 comparable Financials, the upper-band share falls from 28.6% to 7.1%. Citigroup and Morgan Stanley move from class 3 to class 1, while Goldman Sachs declines from class 3 to class 2. The sector’s average class decreases from 1.29 to 0.86, indicating a more contained overall profile.
Consumer Staples: further cooling
Among six Consumer Staples stocks, the average class falls from 1.33 to 0.83. Philip Morris moves from class 3 to class 1, while Procter & Gamble and Coca-Cola remain in class 0. The sector’s share in classes 3–4 halves from 33.3% to 16.7%.
Technology: the elevated-volatility core persists
Information Technology is the main exception to the broad normalisation. Among 29 comparable stocks, the average class remains essentially stable at 3.66 versus 3.69, and 96.6% of constituents stay in classes 3–4. AMAT, AMD, ANET, CRWD, DELL, GLW, INTC, KLAC, LRCX, MRVL, MU, NOW, ORCL, PANW, QCOM, SNDK, STX and WDC continue to concentrate very-high signals.
Communication Services and Consumer Discretionary: pressure remains broad
Among eight comparable Communication Services stocks, the share in classes 3–4 declines only from 87.5% to 75.0%. Among eight Consumer Discretionary stocks, it remains unchanged at 62.5%. Lower average confidence in the upper classes therefore does not materially alter the regime across these two groups.
Most significant changes
The model identifies eight two-class decreases and no increase of the same magnitude:
- PM: class 3 → 1; current confidence 32.7%.
- AMGN: class 3 → 1; current confidence 31.5%.
- TMO: class 3 → 1; current confidence 28.6%.
- UNH: class 3 → 1; current confidence 31.7%.
- C: class 3 → 1; current confidence 30.6%.
- MS: class 3 → 1; current confidence 30.5%.
- WELL: class 3 → 1; current confidence 30.2%.
- DHR: class 3 → 1; current confidence 27.6%.
Overall, 16 stocks leave classes 3–4 and none enters. In addition to the eight major moves, BA, GE, GS, CVS, DE, TMUS, VRTX and MRK move from class 3 to class 2. The universe composition changes marginally: NEM enters the current run, while PGR appeared only in the previous one; neither stock is included in individual week-over-week comparisons.
Risk-management implications
The fall below 50% of comparable stocks in classes 3–4 suggests lower aggregate pressure. The signal is not uniform, however: the high concentration in Technology and the persistence across Communication Services still require attention to sector exposures and correlations.
The forecasts may support risk monitoring, position-sizing reviews and hedging assessments. They should be considered together with liquidity, investment horizon, correlations and the investor’s objectives.
Have a good week
Gandalf Project R&D Team
Important notice — Not financial advice
The information contained in this report is provided solely for educational and informational purposes. It does not constitute a solicitation of public savings, an investment recommendation, or an offer to buy or sell financial instruments. Gandalf Project accepts no responsibility for investment decisions made on the basis of this report. Investors should conduct their own assessments and, where appropriate, consult a qualified financial adviser.
