
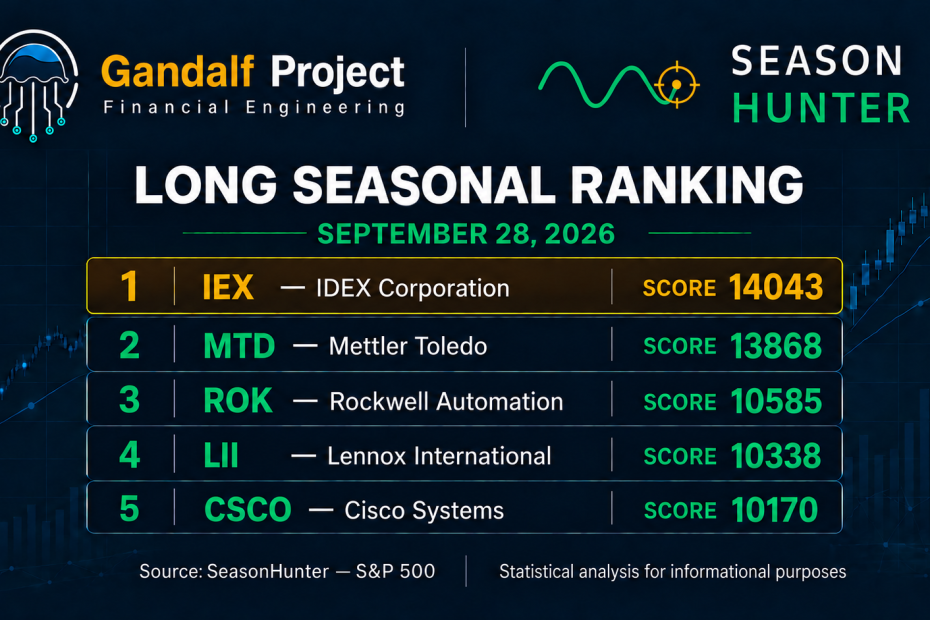
Le migliori stagionalità in partenza: 28 settembre 2026
Scopri direttamente le stagionalità del mercato. Registrati gratuitamente su SeasonHunter e utilizza gli screener completi per 14 giorni.
Prova SeasonHunter gratuitamente
SeasonHunter analizza migliaia di strumenti finanziari alla ricerca di pattern stagionali ricorrenti.
Lo screening restituisce 322 Long e 46 Short. Entrambe le classifiche sono state verificate e ricomposte in ordinamento globale SCORE ▼.
Top 10 Long per Score
| Titolo | Finestra | Giorni | Anni | Successo | Profitto medio | Media negativa | Score |
|---|---|---|---|---|---|---|---|
| IEX | 28 ott–7 dic | 40 | 37 | 94,59% | 6,12% | -2,58% | 14043 |
| MTD | 23 ott–7 nov | 15 | 28 | 96,43% | 6,74% | -6,41% | 13868 |
| ROK | 28 ott–27 dic | 60 | 44 | 90,91% | 10,10% | -4,84% | 10585 |
| LII | 28 ott–7 dic | 40 | 27 | 92,59% | 6,96% | -1,91% | 10338 |
| CSCO | 26 ott–5 nov | 10 | 36 | 88,89% | 4,59% | -1,47% | 10170 |
| PH | 27 ott–6 dic | 40 | 46 | 89,13% | 8,41% | -2,67% | 10025 |
| UPS | 12 ott–1 dic | 50 | 26 | 92,31% | 6,68% | -3,78% | 9777 |
| GPC | 27 ott–6 dic | 40 | 46 | 89,13% | 5,08% | -2,48% | 9080 |
| BLK | 24 ott–23 dic | 60 | 27 | 85,19% | 9,17% | -2,35% | 8983 |
| AME | 27 ott–26 dic | 60 | 42 | 85,71% | 7,43% | -3,78% | 8905 |
IEX supera MTD, con sei Long sopra quota 10.000
IEX guida con Score 14043 e precede MTD di 175 punti. MTD ha il win rate più alto, 96,43%, ma IEX presenta una perdita media più contenuta. ROK offre il profitto medio migliore della top ten, +10,10%, mentre CSCO è il pattern più compatto ed equilibrato: dieci giorni, Score 10170 e appena -1,47% medio nelle annate negative. Tutti i primi sei superano quota 10.000, ma le finestre iniziano fra il 23 e il 28 ottobre.
Top 10 Short per Score
| Titolo | Finestra | Giorni | Anni | Successo | Profitto medio | Media negativa | Score |
|---|---|---|---|---|---|---|---|
| DGX | 28 set–13 ott | 15 | 29 | 72,41% | 3,11% | -2,20% | 3912 |
| TGT | 22–27 ott | 5 | 53 | 71,70% | 1,82% | -2,16% | 3515 |
| HSIC | 8–13 ott | 5 | 30 | 73,33% | 1,16% | -1,80% | 3478 |
| TECH | 5–10 ott | 5 | 37 | 70,27% | 1,76% | -2,14% | 3403 |
| WSM | 22–27 ott | 5 | 43 | 74,42% | 1,71% | -2,77% | 3381 |
| DVA | 20–30 ott | 10 | 30 | 70,00% | 2,80% | -3,49% | 3145 |
| RMD | 29 set–9 ott | 10 | 31 | 70,97% | 2,40% | -2,99% | 3071 |
| YUM | 21–26 ott | 5 | 29 | 72,41% | 0,98% | -1,61% | 3051 |
| INTU | 28 set–3 ott | 5 | 33 | 75,76% | 1,72% | -2,90% | 3050 |
| WMB | 21–26 ott | 5 | 44 | 70,45% | 1,83% | -2,57% | 2992 |
Gli Short scendono a soli 46 pattern e il leader DGX resta sotto quota 4000. DGX parte oggi e combina +3,11% medio con -2,20% nelle annate negative. TGT vanta il campione più ampio, 53 anni, mentre HSIC e YUM hanno i downside più contenuti. DVA offre +2,80% medio, ma appare più fragile con -3,49%.
Leader a confronto. IEX supera DGX di 10131 punti: la qualità statistica è nettamente concentrata sui Long, ma i leader assoluti iniziano a fine ottobre. Oggi DGX è il segnale più forte; MDT guida i Long odierni con Score modesto, 2147.
Ranking giornaliero: 28 settembre–4 ottobre
| Data | Miglior Long | Miglior Short |
|---|---|---|
| 28 settembre | MDT 2147 · 20 gg · 53 anni · 73,58% · +2,05% / -6,22% | DGX 3912 · 15 gg · 29 anni · 72,41% · +3,11% / -2,20% |
| 29 settembre | CPB 4370 · 50 gg · 53 anni · 81,13% · +4,25% / -6,80% | RMD 3071 · 10 gg · 31 anni · 70,97% · +2,40% / -2,99% |
| 30 settembre | PTC 4948 · 45 gg · 36 anni · 83,33% · +11,65% / -16,27% | Nessun pattern |
| 1 ottobre | Nessun pattern | BIIB 1604 · 5 gg · 35 anni · 71,43% · +1,01% / -3,77% |
| 2 ottobre | Nessun pattern | Nessun pattern |
| 3 ottobre | JKHY 4536 · 45 gg · 40 anni · 72,50% · +7,17% / -4,68% | ALGN 820 · 5 gg · 25 anni · 72,00% · +0,82% / -7,01% |
| 4 ottobre | MMM 5325 · 55 gg · 64 anni · 78,13% · +5,22% / -5,60% | Nessun pattern |
Lettura della settimana
MMM è il leader giornaliero della settimana con Score 5325 e il campione più ampio, 64 anni. PTC offre il rendimento medio più alto, ma è fragile per una perdita media di -16,27%. JKHY è più equilibrato. Il 2 ottobre non emerge alcun pattern e il lato Short è discontinuo: DGX è l’unico sopra 3900, mentre BIIB e soprattutto ALGN hanno Score deboli.
Confronto con il 21 settembre
I Long salgono da 289 a 322, mentre gli Short scendono da 69 a 46. IEX supera MTD e sale da 10834 a 14043; MTD migliora a 13868. ROK, LII e PH avanzano nettamente, mentre UPS scende dal terzo al settimo posto con Score invariato. CSCO, GPC, BLK e AME entrano nella top ten. Negli Short DGX sale dal terzo al primo posto; A, NTAP, LIN, PTC, NEM e BSX escono.
Come leggere lo screening
Le ricorrenze storiche non incorporano automaticamente valutazioni, utili, notizie, liquidità o regime di mercato. Score, numerosità, rischio medio nelle annate negative e prossimità della finestra vanno valutati separatamente.
Buona settimana
Gandalf Project R&D Team
Vuoi creare i tuoi screening? Registrati gratuitamente su SeasonHunter e prova per 14 giorni gli screener utilizzati per questa analisi.
Registrati gratuitamenteAvvertenza importante — Non è consulenza finanziaria
Le informazioni sono fornite esclusivamente a scopo educativo e informativo. Le statistiche stagionali si basano su dati storici e non garantiscono risultati futuri. Il report non costituisce una raccomandazione, sollecitazione od offerta di acquisto o vendita di strumenti finanziari.
Best Upcoming Seasonal Patterns: September 28, 2026
Explore market seasonality directly. Register for free with SeasonHunter and use the complete screeners for 14 days.
Try SeasonHunter for freeSeasonHunter screens thousands of financial instruments for recurring seasonal patterns.
The screen returns 322 Long and 46 Short configurations. Both rankings were verified and reconstructed in global SCORE ▼ order.
Top 10 Longs by Score
| Stock | Window | Days | Years | Win rate | Avg profit | Avg negative | Score |
|---|---|---|---|---|---|---|---|
| IEX | Oct 28–Dec 7 | 40 | 37 | 94.59% | 6.12% | -2.58% | 14043 |
| MTD | Oct 23–Nov 7 | 15 | 28 | 96.43% | 6.74% | -6.41% | 13868 |
| ROK | Oct 28–Dec 27 | 60 | 44 | 90.91% | 10.10% | -4.84% | 10585 |
| LII | Oct 28–Dec 7 | 40 | 27 | 92.59% | 6.96% | -1.91% | 10338 |
| CSCO | Oct 26–Nov 5 | 10 | 36 | 88.89% | 4.59% | -1.47% | 10170 |
| PH | Oct 27–Dec 6 | 40 | 46 | 89.13% | 8.41% | -2.67% | 10025 |
| UPS | Oct 12–Dec 1 | 50 | 26 | 92.31% | 6.68% | -3.78% | 9777 |
| GPC | Oct 27–Dec 6 | 40 | 46 | 89.13% | 5.08% | -2.48% | 9080 |
| BLK | Oct 24–Dec 23 | 60 | 27 | 85.19% | 9.17% | -2.35% | 8983 |
| AME | Oct 27–Dec 26 | 60 | 42 | 85.71% | 7.43% | -3.78% | 8905 |
IEX overtakes MTD, with six Longs above 10,000
IEX leads at 14043, 175 points ahead of MTD. MTD has the highest win rate at 96.43%, while IEX has the milder average downside. ROK delivers the top average profit at +10.10%. CSCO is the most compact and balanced pattern: ten days, a 10170 Score and only -1.47% in losing years. All six leaders exceed 10,000, but their windows begin between October 23 and 28.
Top 10 Shorts by Score
| Stock | Window | Days | Years | Win rate | Avg profit | Avg negative | Score |
|---|---|---|---|---|---|---|---|
| DGX | Sep 28–Oct 13 | 15 | 29 | 72.41% | 3.11% | -2.20% | 3912 |
| TGT | Oct 22–27 | 5 | 53 | 71.70% | 1.82% | -2.16% | 3515 |
| HSIC | Oct 8–13 | 5 | 30 | 73.33% | 1.16% | -1.80% | 3478 |
| TECH | Oct 5–10 | 5 | 37 | 70.27% | 1.76% | -2.14% | 3403 |
| WSM | Oct 22–27 | 5 | 43 | 74.42% | 1.71% | -2.77% | 3381 |
| DVA | Oct 20–30 | 10 | 30 | 70.00% | 2.80% | -3.49% | 3145 |
| RMD | Sep 29–Oct 9 | 10 | 31 | 70.97% | 2.40% | -2.99% | 3071 |
| YUM | Oct 21–26 | 5 | 29 | 72.41% | 0.98% | -1.61% | 3051 |
| INTU | Sep 28–Oct 3 | 5 | 33 | 75.76% | 1.72% | -2.90% | 3050 |
| WMB | Oct 21–26 | 5 | 44 | 70.45% | 1.83% | -2.57% | 2992 |
Shorts fall to only 46 patterns and leader DGX remains below 4000. DGX starts today and combines +3.11% average profit with -2.20% in losing years. TGT has the longest sample at 53 years, while HSIC and YUM show the mildest downside. DVA offers +2.80% on average but is more fragile at -3.49%.
Leader comparison. IEX leads DGX by 10131 points: statistical quality is heavily concentrated on Longs, although the absolute leaders start in late October. DGX is today’s strongest signal; MDT leads today’s Longs with a modest 2147 Score.
Daily ranking: September 28–October 4
| Date | Best Long | Best Short |
|---|---|---|
| Sep 28 | MDT 2147 · 20d · 53y · 73.58% · +2.05% / -6.22% | DGX 3912 · 15d · 29y · 72.41% · +3.11% / -2.20% |
| Sep 29 | CPB 4370 · 50d · 53y · 81.13% · +4.25% / -6.80% | RMD 3071 · 10d · 31y · 70.97% · +2.40% / -2.99% |
| Sep 30 | PTC 4948 · 45d · 36y · 83.33% · +11.65% / -16.27% | No pattern |
| Oct 1 | No pattern | BIIB 1604 · 5d · 35y · 71.43% · +1.01% / -3.77% |
| Oct 2 | No pattern | No pattern |
| Oct 3 | JKHY 4536 · 45d · 40y · 72.50% · +7.17% / -4.68% | ALGN 820 · 5d · 25y · 72.00% · +0.82% / -7.01% |
| Oct 4 | MMM 5325 · 55d · 64y · 78.13% · +5.22% / -5.60% | No pattern |
Reading the week
MMM is the week’s daily leader at 5325 and has the longest sample, 64 years. PTC offers the highest average return but is fragile at -16.27% in losing years; JKHY is better balanced. October 2 has no qualifying pattern. The Short side is intermittent: DGX is the only name above 3900, while BIIB and especially ALGN carry weak Scores.
Comparison with September 21
Long configurations rise from 289 to 322, while Shorts decline from 69 to 46. IEX overtakes MTD and climbs from 10834 to 14043; MTD improves to 13868. ROK, LII and PH advance sharply, while UPS falls from third to seventh with an unchanged Score. CSCO, GPC, BLK and AME enter the top ten. Among Shorts, DGX moves from third to first; A, NTAP, LIN, PTC, NEM and BSX leave.
How to read the screen
Historical recurrence does not automatically account for valuation, earnings, news, liquidity or market regime. Score, sample size, average downside and window proximity must be assessed separately.
Have a good week
Gandalf Project R&D Team
Want to build your own screens? Register for free with SeasonHunter and try the screeners used in this analysis for 14 days.
Register for freeImportant notice — Not financial advice
This information is provided solely for educational and informational purposes. Seasonal statistics are based on historical data and do not guarantee future results. This report is not an investment recommendation, solicitation or offer to buy or sell financial instruments.
