
Le migliori stagionalità in partenza: 21 settembre 2026
Scopri direttamente le stagionalità del mercato. Registrati gratuitamente su SeasonHunter e utilizza gli screener completi per 14 giorni.
Prova SeasonHunter gratuitamente
SeasonHunter analizza migliaia di strumenti finanziari alla ricerca di pattern stagionali ricorrenti.
Lo screening restituisce 289 Long e 69 Short. Entrambe le classifiche sono state verificate e ricomposte in ordinamento globale SCORE ▼.
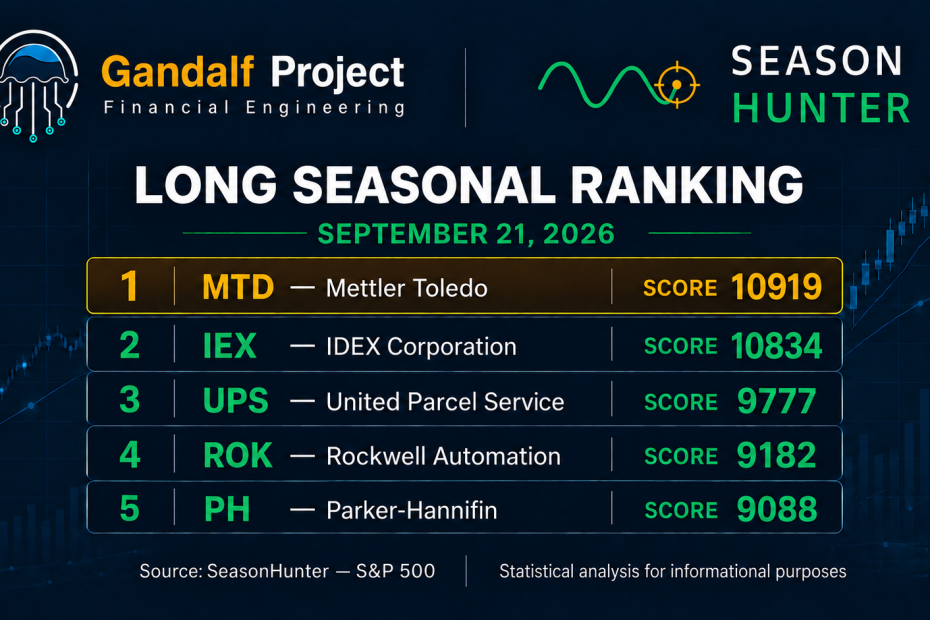
Top 10 Long per Score
| Titolo | Finestra | Giorni | Anni | Successo | Profitto medio | Media negativa | Score |
|---|---|---|---|---|---|---|---|
| MTD | 21 ott–5 nov | 15 | 28 | 89,29% | 5,94% | -3,16% | 10919 |
| IEX | 19 ott–8 dic | 50 | 37 | 91,89% | 6,97% | -1,28% | 10834 |
| UPS | 12 ott–1 dic | 50 | 26 | 92,31% | 6,68% | -3,78% | 9777 |
| ROK | 19 ott–18 dic | 60 | 44 | 86,36% | 9,67% | -3,17% | 9182 |
| PH | 19 ott–28 nov | 40 | 46 | 84,78% | 7,68% | -2,88% | 9088 |
| APH | 11 ott–5 nov | 25 | 34 | 94,12% | 7,58% | -8,85% | 8403 |
| LII | 19 ott–8 dic | 50 | 27 | 88,89% | 8,74% | -6,85% | 8300 |
| TPR | 12 ott–6 dic | 55 | 26 | 88,46% | 14,90% | -10,16% | 7934 |
| STLD | 17 ott–6 nov | 20 | 29 | 82,76% | 7,29% | -5,19% | 7838 |
| AZO | 9 ott–8 dic | 60 | 35 | 82,86% | 10,49% | -4,07% | 7792 |
MTD e IEX formano una coppia di testa
MTD guida con Score 10919, appena 85 punti davanti a IEX. IEX appare particolarmente equilibrato: 91,89% di successi su 37 anni e appena -1,28% medio nelle annate negative. UPS resta solido al terzo posto e ha il win rate più alto fra i primi tre. ROK e PH combinano Score superiori a 9000 con campioni di 44–46 anni. TPR offre il profitto medio più alto, +14,90%, ma anche una coda negativa di -10,16%; APH, pur al 94,12% di successi, resta esposto a -8,85% nelle annate sfavorevoli.
Top 10 Short per Score
| Titolo | Finestra | Giorni | Anni | Successo | Profitto medio | Media negativa | Score |
|---|---|---|---|---|---|---|---|
| A | 21–26 set | 5 | 26 | 73,08% | 1,83% | -1,55% | 4158 |
| NTAP | 22 set–2 ott | 10 | 30 | 73,33% | 3,58% | -2,89% | 3972 |
| DGX | 28 set–13 ott | 15 | 29 | 72,41% | 3,11% | -2,20% | 3912 |
| LIN | 21–26 set | 5 | 34 | 79,41% | 1,58% | -2,83% | 3506 |
| PTC | 21–26 set | 5 | 36 | 72,22% | 2,34% | -2,93% | 3495 |
| HSIC | 8–13 ott | 5 | 30 | 73,33% | 1,16% | -1,80% | 3478 |
| NEM | 24 set–29 ott | 35 | 46 | 71,74% | 5,38% | -5,24% | 3411 |
| TECH | 5–10 ott | 5 | 37 | 70,27% | 1,76% | -2,14% | 3403 |
| WSM | 21–26 ott | 5 | 43 | 72,09% | 1,92% | -2,29% | 3333 |
| BSX | 21–26 set | 5 | 34 | 70,59% | 2,02% | -2,69% | 3332 |
Il lato Short è molto meno affollato e nessun candidato supera quota 4200. A è il leader e parte oggi, con finestra breve e downside medio contenuto; NTAP lo segue a 186 punti con profitto medio più elevato. NEM produce il rendimento medio migliore della top ten, ma la finestra di 35 giorni e la media negativa di -5,24% lo rendono più sensibile. LIN offre il win rate più alto, mentre A presenta il profilo di perdita media più contenuto.
Leader a confronto. MTD supera A di 6761 punti: il vantaggio dei Long è netto, ma i leader MTD e IEX partono soltanto il 19–21 ottobre. Per l’operatività più vicina, SCHW Long e A Short sono i migliori pattern che iniziano oggi.
Ranking giornaliero: 21–27 settembre
| Data | Miglior Long | Miglior Short |
|---|---|---|
| 21 settembre | SCHW 4558 · 55 gg · 38 anni · 76,32% · +9,84% / -9,80% | A 4158 · 5 gg · 26 anni · 73,08% · +1,83% / -1,55% |
| 22 settembre | PAYX 4536 · 55 gg · 43 anni · 76,74% · +6,79% / -9,64% | NTAP 3972 · 10 gg · 30 anni · 73,33% · +3,58% / -2,89% |
| 23 settembre | GL 3677 · 55 gg · 45 anni · 82,22% · +6,14% / -14,35% | AAPL 2676 · 10 gg · 45 anni · 73,33% · +3,60% / -3,54% |
| 24 settembre | FDX 4387 · 20 gg · 48 anni · 79,17% · +4,43% / -5,61% | NEM 3411 · 35 gg · 46 anni · 71,74% · +5,38% / -5,24% |
| 25 settembre | WTW 5531 · 10 gg · 25 anni · 80,00% · +2,30% / -2,13% | Nessun pattern |
| 26 settembre | ORCL 2898 · 50 gg · 40 anni · 75,00% · +6,16% / -12,86% | MDLZ 2834 · 15 gg · 25 anni · 72,00% · +1,73% / -2,12% |
| 27 settembre | PTC 4958 · 45 gg · 36 anni · 80,56% · +11,69% / -12,90% | GILD 2944 · 5 gg · 34 anni · 79,41% · +1,66% / -3,49% |
Lettura della settimana
WTW è il leader settimanale per Score e offre un profilo compatto: dieci giorni, 80% di successi e -2,13% medio nelle annate negative. PTC del 27 settembre ha rendimento medio molto più alto, ma una coda negativa quasi altrettanto ampia. SCHW, PAYX e GL richiedono cautela per finestre lunghe e downside fra -9,64% e -14,35%. Sul lato Short, A e NTAP sono i segnali più convincenti; il 25 settembre non emerge alcun pattern qualificato.
Confronto con il 14 settembre
I Long salgono da 278 a 289, mentre gli Short crollano da 184 a 69 perché molte finestre brevi della scorsa settimana sono ormai trascorse. MTD resta primo e sale da 9992 a 10919; IEX balza dal terzo al secondo posto con 10834. UPS scende al terzo pur mantenendo Score 9777. Entrano ROK, LII e STLD; escono SO, RSG e ORLY. La precedente top ten Short scompare quasi interamente: A resta presente, ma con una nuova finestra 21–26 settembre e Score 4158.
Come leggere lo screening
Le ricorrenze storiche non incorporano automaticamente valutazioni, utili, notizie, liquidità o regime di mercato. Score, numerosità, rischio medio nelle annate negative e prossimità della finestra vanno valutati separatamente.
Buona settimana
Gandalf Project R&D Team
Vuoi creare i tuoi screening? Registrati gratuitamente su SeasonHunter e prova per 14 giorni gli screener utilizzati per questa analisi.
Registrati gratuitamenteAvvertenza importante — Non è consulenza finanziaria
Le informazioni sono fornite esclusivamente a scopo educativo e informativo. Le statistiche stagionali si basano su dati storici e non garantiscono risultati futuri. Il report non costituisce una raccomandazione, sollecitazione od offerta di acquisto o vendita di strumenti finanziari.
Best Upcoming Seasonal Patterns: September 21, 2026
Explore market seasonality directly. Register for free with SeasonHunter and use the complete screeners for 14 days.
Try SeasonHunter for freeSeasonHunter screens thousands of financial instruments for recurring seasonal patterns.
The screen returns 289 Long and 69 Short configurations. Both rankings were verified and reconstructed in global SCORE ▼ order.
Top 10 Longs by Score
| Stock | Window | Days | Years | Win rate | Avg profit | Avg negative | Score |
|---|---|---|---|---|---|---|---|
| MTD | Oct 21–Nov 5 | 15 | 28 | 89.29% | 5.94% | -3.16% | 10919 |
| IEX | Oct 19–Dec 8 | 50 | 37 | 91.89% | 6.97% | -1.28% | 10834 |
| UPS | Oct 12–Dec 1 | 50 | 26 | 92.31% | 6.68% | -3.78% | 9777 |
| ROK | Oct 19–Dec 18 | 60 | 44 | 86.36% | 9.67% | -3.17% | 9182 |
| PH | Oct 19–Nov 28 | 40 | 46 | 84.78% | 7.68% | -2.88% | 9088 |
| APH | Oct 11–Nov 5 | 25 | 34 | 94.12% | 7.58% | -8.85% | 8403 |
| LII | Oct 19–Dec 8 | 50 | 27 | 88.89% | 8.74% | -6.85% | 8300 |
| TPR | Oct 12–Dec 6 | 55 | 26 | 88.46% | 14.90% | -10.16% | 7934 |
| STLD | Oct 17–Nov 6 | 20 | 29 | 82.76% | 7.29% | -5.19% | 7838 |
| AZO | Oct 9–Dec 8 | 60 | 35 | 82.86% | 10.49% | -4.07% | 7792 |
MTD and IEX form a leading pair
MTD leads with a 10919 Score, only 85 points ahead of IEX. IEX is particularly balanced: a 91.89% win rate over 37 years and only -1.28% on average in losing years. UPS remains solid in third and has the highest win rate among the first three. ROK and PH combine Scores above 9000 with 44–46 years of history. TPR has the highest average profit at +14.90%, but also a -10.16% negative tail; APH reaches a 94.12% win rate yet still carries -8.85% average downside.
Top 10 Shorts by Score
| Stock | Window | Days | Years | Win rate | Avg profit | Avg negative | Score |
|---|---|---|---|---|---|---|---|
| A | Sep 21–26 | 5 | 26 | 73.08% | 1.83% | -1.55% | 4158 |
| NTAP | Sep 22–Oct 2 | 10 | 30 | 73.33% | 3.58% | -2.89% | 3972 |
| DGX | Sep 28–Oct 13 | 15 | 29 | 72.41% | 3.11% | -2.20% | 3912 |
| LIN | Sep 21–26 | 5 | 34 | 79.41% | 1.58% | -2.83% | 3506 |
| PTC | Sep 21–26 | 5 | 36 | 72.22% | 2.34% | -2.93% | 3495 |
| HSIC | Oct 8–13 | 5 | 30 | 73.33% | 1.16% | -1.80% | 3478 |
| NEM | Sep 24–Oct 29 | 35 | 46 | 71.74% | 5.38% | -5.24% | 3411 |
| TECH | Oct 5–10 | 5 | 37 | 70.27% | 1.76% | -2.14% | 3403 |
| WSM | Oct 21–26 | 5 | 43 | 72.09% | 1.92% | -2.29% | 3333 |
| BSX | Sep 21–26 | 5 | 34 | 70.59% | 2.02% | -2.69% | 3332 |
The Short side is much thinner and no candidate exceeds 4200. A leads and starts today with a short window and contained average downside; NTAP follows by 186 points with higher average profit. NEM has the best average return in the top ten, but its 35-day window and -5.24% average downside make it more sensitive. LIN has the highest win rate, while A has the mildest average loss profile.
Leader comparison. MTD leads A by 6761 points: the Long advantage is clear, although MTD and IEX do not begin until October 19–21. For immediate signals, SCHW Long and A Short are the strongest patterns starting today.
Daily ranking: September 21–27
| Date | Best Long | Best Short |
|---|---|---|
| Sep 21 | SCHW 4558 · 55d · 38y · 76.32% · +9.84% / -9.80% | A 4158 · 5d · 26y · 73.08% · +1.83% / -1.55% |
| Sep 22 | PAYX 4536 · 55d · 43y · 76.74% · +6.79% / -9.64% | NTAP 3972 · 10d · 30y · 73.33% · +3.58% / -2.89% |
| Sep 23 | GL 3677 · 55d · 45y · 82.22% · +6.14% / -14.35% | AAPL 2676 · 10d · 45y · 73.33% · +3.60% / -3.54% |
| Sep 24 | FDX 4387 · 20d · 48y · 79.17% · +4.43% / -5.61% | NEM 3411 · 35d · 46y · 71.74% · +5.38% / -5.24% |
| Sep 25 | WTW 5531 · 10d · 25y · 80.00% · +2.30% / -2.13% | No pattern |
| Sep 26 | ORCL 2898 · 50d · 40y · 75.00% · +6.16% / -12.86% | MDLZ 2834 · 15d · 25y · 72.00% · +1.73% / -2.12% |
| Sep 27 | PTC 4958 · 45d · 36y · 80.56% · +11.69% / -12.90% | GILD 2944 · 5d · 34y · 79.41% · +1.66% / -3.49% |
Reading the week
WTW is the weekly Score leader and offers a compact profile: ten days, an 80% win rate and -2.13% average downside in losing years. PTC on September 27 has a much higher average return, but an almost equally large negative tail. SCHW, PAYX and GL call for caution because of long windows and downside between -9.64% and -14.35%. On the Short side, A and NTAP are the most convincing signals; no qualifying Short pattern starts on September 25.
Comparison with September 14
Long configurations rise from 278 to 289, while Shorts fall sharply from 184 to 69 as many of last week’s short windows have passed. MTD stays first and improves from 9992 to 10919; IEX jumps from third to second at 10834. UPS slips to third while retaining a 9777 Score. ROK, LII and STLD enter; SO, RSG and ORLY leave. The former Short top ten almost entirely disappears: A remains, but with a new September 21–26 window and a 4158 Score.
How to read the screen
Historical recurrence does not automatically account for valuation, earnings, news, liquidity or market regime. Score, sample size, average downside and window proximity must be assessed separately.
Have a good week
Gandalf Project R&D Team
Want to build your own screens? Register for free with SeasonHunter and try the screeners used in this analysis for 14 days.
Register for freeImportant notice — Not financial advice
This information is provided solely for educational and informational purposes. Seasonal statistics are based on historical data and do not guarantee future results. This report is not an investment recommendation, solicitation or offer to buy or sell financial instruments.
