
Stagionalità del lunedì: leader Long stabili, il calendario entra nel vivo
Esplora le stagionalità con SeasonHunter. Registrati gratuitamente su www.seasonhunter.com e utilizza gli screener per 14 giorni con l’offerta dedicata ai lettori.
Registrati gratuitamente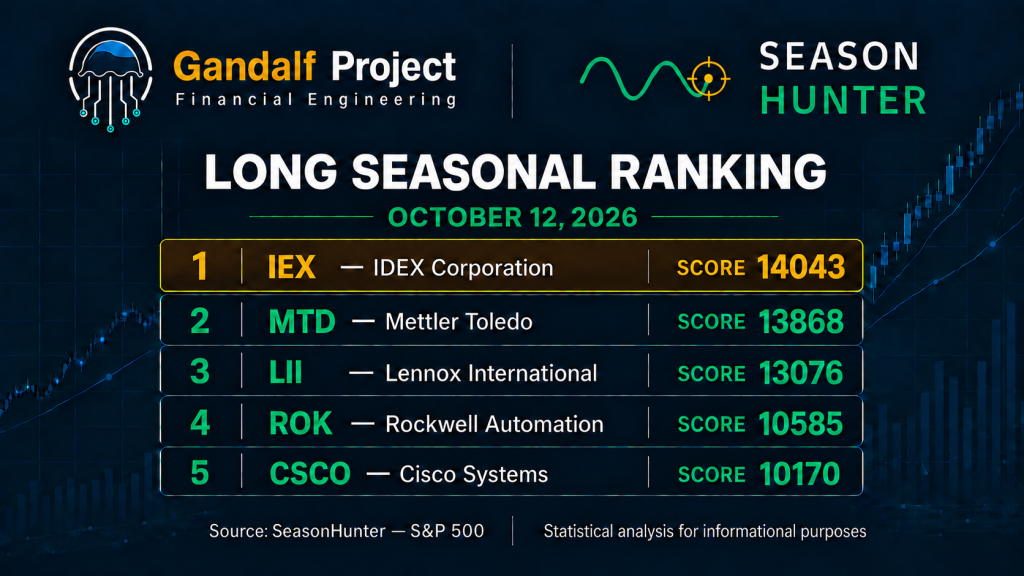
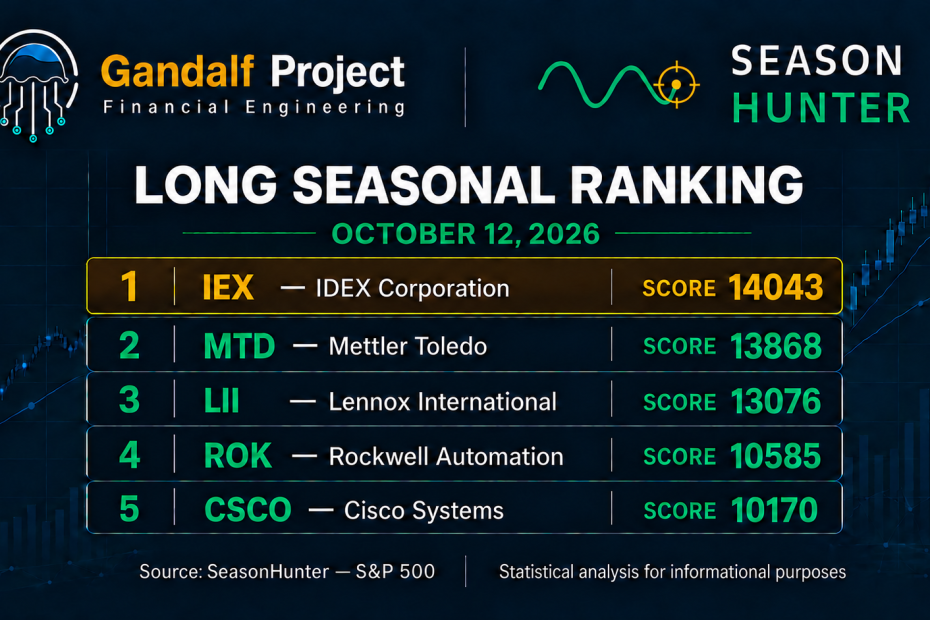
Lo screening del 12 ottobre restituisce 336 risultati Long e 38 Short. La top 10 Long è identica a quella del 5 ottobre: IEX resta a 14043, MTD a 13868 e LII a 13076. La novità non è un’accelerazione degli Score, ma l’avvicinarsi delle finestre e il ricambio nella graduatoria Short.
I leader assoluti Long partono fra il 23 e il 31 ottobre, quindi non sono segnali d’ingresso per oggi. Il calendario del 12–18 ottobre offre una lettura distinta: Southern apre la settimana, YUM emerge giovedì e Steel Dynamics guida le partenze del weekend, secondo le date grezze dello screener.
Top 10 Long per Score
| # | Titolo | Finestra | Giorni | Campione | Successo | Profitto medio | Media negativa | Score |
|---|---|---|---|---|---|---|---|---|
| 1 | IEX IDEX Corporation | 28/10–7/12 | 40 | 37 | 94,59% | 6,12% | -2,58% | 14043 |
| 2 | MTD Mettler Toledo | 23/10–7/11 | 15 | 28 | 96,43% | 6,74% | -6,41% | 13868 |
| 3 | LII Lennox International | 29/10–8/12 | 40 | 27 | 96,30% | 7,68% | -0,83% | 13076 |
| 4 | ROK Rockwell Automation | 28/10–27/12 | 60 | 44 | 90,91% | 10,10% | -4,84% | 10585 |
| 5 | CSCO Cisco Systems | 26/10–5/11 | 10 | 36 | 88,89% | 4,59% | -1,47% | 10170 |
| 6 | UPS United Parcel Service | 31/10–30/11 | 30 | 26 | 92,31% | 4,87% | -3,97% | 10040 |
| 7 | PH Parker-Hannifin | 27/10–6/12 | 40 | 46 | 89,13% | 8,41% | -2,67% | 10025 |
| 8 | GPC Genuine Parts | 27/10–6/12 | 40 | 46 | 89,13% | 5,08% | -2,48% | 9080 |
| 9 | BLK BlackRock | 24/10–23/12 | 60 | 27 | 85,19% | 9,17% | -2,35% | 8983 |
| 10 | AME AMETEK | 27/10–26/12 | 60 | 42 | 85,71% | 7,43% | -3,78% | 8905 |
IEX, MTD e LII: distacchi stretti, rischio non equivalente
IEX precede MTD di soli 175 punti; fra MTD e LII il divario è di 792 punti. Il salto successivo è più ampio: LII distanzia ROK di 2491 punti. Questi numeri descrivono un ordine statistico, non probabilità di rendimento né una scala lineare di qualità.
IEX combina 35 successi su 37 osservazioni, profitto medio del 6,12% e media negativa del -2,58% in 40 giorni. È un profilo storicamente interessante, ma la componente perdente comprende appena due casi. MTD concentra il 6,74% medio in 15 giorni, con 27 successi su 28: il -6,41% negativo deriva da un solo episodio. Anche LII, 26 successi su 27, ha una sola perdita nel campione: il -0,83% non va scambiato per un limite al rischio futuro.
Durata e solidità del campione contano
CSCO presenta una combinazione relativamente equilibrata tra finestra breve (10 giorni), 36 osservazioni, win rate 88,89%, profitto medio 4,59% e media negativa -1,47%. Il campione perdente resta comunque limitato a quattro casi. PH, su 46 osservazioni, associa 8,41% medio e -2,67% negativo in 40 giorni; GPC condivide durata e win rate, ma ha un rendimento medio più contenuto, 5,08%.
ROK supera il 10% medio storico, ma richiede 60 giorni e presenta una media negativa del -4,84%. Anche BLK e AME occupano finestre di 60 giorni. Confrontare questi rendimenti con quelli di CSCO senza considerare il tempo di esposizione sarebbe fuorviante; non sono rendimenti annualizzati. Sei dei dieci titoli appartengono agli Industrials secondo lo screener: la concentrazione settoriale merita attenzione, non equivale a diversificazione.
Top 10 Short per Score
| # | Titolo | Finestra | Giorni | Campione | Successo | Profitto medio | Media negativa | Score |
|---|---|---|---|---|---|---|---|---|
| 1 | TGT Target Corp | 22/10–27/10 | 5 | 53 | 71,70% | 1,82% | -2,16% | 3515 |
| 2 | WSM Williams-Sonoma | 22/10–27/10 | 5 | 43 | 74,42% | 1,71% | -2,77% | 3381 |
| 3 | DVA DaVita | 20/10–30/10 | 10 | 30 | 70,00% | 2,80% | -3,49% | 3145 |
| 4 | YUM Yum Brands | 21/10–26/10 | 5 | 29 | 72,41% | 0,98% | -1,61% | 3051 |
| 5 | WMB Williams | 21/10–26/10 | 5 | 44 | 70,45% | 1,83% | -2,57% | 2992 |
| 6 | HSIC Henry Schein | 22/10–27/10 | 5 | 30 | 70,00% | 1,63% | -2,30% | 2941 |
| 7 | CAG Conagra Brands | 22/10–27/10 | 5 | 46 | 73,91% | 1,26% | -2,22% | 2916 |
| 8 | MKC McCormick | 22/10–27/10 | 5 | 53 | 77,36% | 1,12% | -2,69% | 2811 |
| 9 | COF Capital One Financial | 9/11–19/11 | 10 | 31 | 74,19% | 2,10% | -3,23% | 2683 |
| 10 | DVN Devon Energy | 25/10–30/10 | 5 | 41 | 70,73% | 1,43% | -2,80% | 2678 |
TGT resta primo a 3515, davanti a WSM a 3381: il distacco è di 134 punti. Entrambi riguardano il 22–27 ottobre, con campioni rispettivamente di 53 e 43 osservazioni. TGT ha profitto medio 1,82% e media negativa -2,16%; WSM 1,71% e -2,77%. Sono pattern più modesti rispetto ai leader Long nei valori restituiti dalla piattaforma, non coperture automaticamente efficaci.
DVA offre il profitto medio più alto della top 10 Short (2,80%), ma il win rate è esattamente sulla soglia del 70%, con 30 osservazioni e media negativa -3,49%. MKC ha il win rate più alto del gruppo (77,36%), ma solo 1,12% medio contro -2,69% nelle perdite. Un’alta frequenza di successi, isolata dalla loro ampiezza, non basta. COF, nono a 2683, riguarda novembre: è distante 28 giorni e non appartiene al calendario operativo di questa settimana.
Cosa cambia rispetto al 5 ottobre
I Long passano da 334 a 336 risultati; gli Short restano 38. Nella top 10 Long non vi sono ingressi, uscite, cambi di posizione o di Score: anche le finestre restano invariate. L’aggiornamento conferma dunque gli stessi pattern, senza fornire evidenza di un loro rafforzamento.
Fra gli Short, COF entra al nono posto e TECH esce dalla top 10. WSM sale dal quarto al secondo, DVA dal quinto al terzo, YUM dal sesto al quarto e WMB dal settimo al quinto, tutti con Score invariato. CAG passa dall’ottavo al settimo, MKC dal nono all’ottavo; TGT e DVN restano primo e decimo.
HSIC scende dal secondo al sesto posto, da 3478 a 2941 (-537 punti), ma il confronto riguarda due finestre diverse: 8–13 ottobre nella lettura precedente, 22–27 ottobre in quella attuale. Non è corretto descriverlo come deterioramento dello stesso pattern. La scadenza delle partenze precedenti modifica la selezione disponibile.
Calendario daily: 12–18 ottobre
Per ciascuna data riportiamo fino ai due migliori risultati per lato, ordinati per Score e selezionati dopo aver letto tutte le 336 righe Long e le 38 Short. Questa tabella raggruppa i risultati dello screening odierno per data di partenza: non è un nuovo backtest indipendente per ogni giorno.
| Partenza | Long · Score | Short · Score |
|---|---|---|
| 12/10 | SO · 7460 12/10–22/10 · 10 giorni · n=44 Win 77,27% · medio 1,82% · neg. -0,73% ZBRA · 7303 12/10–1/12 · 50 giorni · n=35 Win 82,86% · medio 10,35% · neg. -7,22% | Nessun risultato restituito |
| 13/10 | EQIX · 4211 13/10–7/11 · 25 giorni · n=26 Win 73,08% · medio 5,09% · neg. -4,85% AEP · 3329 13/10–2/11 · 20 giorni · n=64 Win 71,88% · medio 2,15% · neg. -2,72% | Nessun risultato restituito |
| 14/10 | DGX · 6389 14/10–8/12 · 55 giorni · n=29 Win 82,76% · medio 6,92% · neg. -6,24% | Nessun risultato restituito |
| 15/10 | YUM · 7519 15/10–29/11 · 45 giorni · n=29 Win 89,66% · medio 6,75% · neg. -3,76% PG · 5591 15/10–29/11 · 45 giorni · n=64 Win 76,56% · medio 4,36% · neg. -3,23% | Nessun risultato restituito |
| 16/10 | Nessun risultato restituito | BXP · 2677 16/10–21/10 · 5 giorni · n=29 Win 72,41% · medio 0,80% · neg. -1,86% CRL · 2593 16/10–5/11 · 20 giorni · n=26 Win 73,08% · medio 2,60% · neg. -6,18% |
| 17/10 * | STLD · 7838 17/10–6/11 · 20 giorni · n=29 Win 82,76% · medio 7,29% · neg. -5,19% SBUX · 6090 17/10–6/12 · 50 giorni · n=34 Win 82,35% · medio 7,92% · neg. -8,47% | TAP · 2410 17/10–27/10 · 10 giorni · n=51 Win 70,59% · medio 1,74% · neg. -3,76% FIS · 2303 17/10–6/11 · 20 giorni · n=25 Win 72,00% · medio 1,98% · neg. -4,37% |
| 18/10 * | BRO · 2812 18/10–2/12 · 45 giorni · n=45 Win 71,11% · medio 5,19% · neg. -6,55% | ALL · 1973 18/10–28/10 · 10 giorni · n=33 Win 75,76% · medio 1,69% · neg. -6,14% UDR · 1366 18/10–2/11 · 15 giorni · n=46 Win 71,74% · medio 0,91% · neg. -4,14% |
Come leggere la settimana
Lunedì 12: SO (7460) supera ZBRA (7303) di 157 punti, ma i profili sono molto diversi. Southern espone per 10 giorni con media negativa -0,73% su 44 osservazioni; Zebra richiede 50 giorni, punta su un rendimento storico medio molto più elevato (10,35%) e presenta perdite medie del -7,22%. La vicinanza degli Score non implica equivalenza del rischio.
Martedì e mercoledì: EQIX (4211) precede AEP (3329), ma conta 26 osservazioni contro 64 e una media negativa più ampia. DGX (6389) guida il 14 ottobre con una finestra di 55 giorni: il 6,92% medio va letto insieme al -6,24% negativo e a un campione di 29 casi.
Giovedì 15: YUM (7519) distanzia PG (5591) di 1928 punti. Entrambi durano 45 giorni, ma PG ha 64 osservazioni contro 29. Inoltre YUM compare anche Short dal 21 ottobre: la sovrapposizione delle finestre dimostra perché un pattern di lungo periodo non esclude una debolezza di pochi giorni.
Venerdì 16: non sono restituiti Long con quella partenza; fra gli Short BXP (2677) precede CRL (2593) di appena 84 punti. Il profitto medio di BXP è 0,80% in cinque giorni, contro -1,86% medio nei casi negativi: costi e attriti esecutivi possono pesare molto. CRL estende l’esposizione a 20 giorni e porta la perdita media al -6,18%.
Weekend: STLD (7838) è il migliore Long con partenza nella settimana, davanti a SBUX (6090) per il 17 ottobre. TAP guida gli Short dello stesso giorno a 2410, con win rate 70,59% e media negativa -3,76%. Domenica BRO scende a 2812, mentre ALL guida gli Short a 1973: il suo win rate 75,76% convive con perdite medie del -6,14%, a fronte di un profitto medio complessivo dell’1,69%.
* Date non operative: 17 e 18 ottobre cadono nel weekend. Manteniamo le date fornite dalla piattaforma, senza convertirle arbitrariamente nella seduta precedente o successiva. La regola di esecuzione va verificata prima di qualsiasi utilizzo. “Nessun risultato restituito” significa assenza nella selezione odierna, non prova che non esistano altre stagionalità.
Metodo, limiti e conclusione
Fonte: SeasonHunter Screener, consultato il 12 ottobre 2026 nella sessione autenticata. Starting Date 12/10/2026, US · S&P 500, All Sectors, almeno 25 anni, durata 5–60 giorni, win rate minimo 70%. Eseguiti separatamente Long e Short con Sort By Score e verificato l’ordinamento globale SCORE ▼, anche tra le pagine.
Il campione riproduce la colonna “Trades”. Il win rate è una frequenza storica; la media negativa è la media dei risultati perdenti, non il massimo drawdown o la massima perdita. Lo Score è il criterio di graduatoria della piattaforma, non una probabilità. Non presumiamo che costi, slippage e prestito titoli siano inclusi. La selezione fra numerose finestre espone a sovraottimizzazione; gli Short comportano inoltre rischi specifici, comprese perdite potenzialmente illimitate.
La lettura del lunedì è quindi di continuità nei leader Long e rotazione negli Short. Per le partenze vicine conta distinguere il profilo breve e contenuto di SO dalle finestre più lunghe di YUM e STLD, senza confondere una graduatoria storica con un segnale operativo autonomo.
Buona settimana
Gandalf Project R&D Team
Esplora le stagionalità con SeasonHunter. Registrati gratuitamente su www.seasonhunter.com e utilizza gli screener per 14 giorni con l’offerta dedicata ai lettori.
Registrati gratuitamenteAvvertenza — Non è consulenza finanziaria
Contenuto esclusivamente informativo e didattico. Le statistiche storiche non garantiscono risultati futuri. Questo articolo non costituisce una raccomandazione personalizzata, una sollecitazione o un’offerta di acquisto o vendita di strumenti finanziari.
Monday seasonality: Long leaders hold steady as the calendar moves closer
Explore seasonality with SeasonHunter. Register for free at www.seasonhunter.com and use the screeners for 14 days with the dedicated reader offer.
Register for freeThe October 12 screening returns 336 Long results and 38 Short results. The Long top 10 is identical to October 5: IEX leads at 14043, followed by MTD at 13868 and LII at 13076. The development is not accelerating Scores, but approaching windows and a reshuffled Short ranking.
The absolute Long leaders start between October 23 and 31, so they are not entry signals for today. The October 12–18 calendar provides a separate perspective: Southern opens the week, YUM stands out on Thursday and Steel Dynamics leads the weekend starts, using the screener’s raw dates.
Top 10 Long patterns by Score
| # | Stock | Window | Days | Sample | Win rate | Avg profit | Avg negative | Score |
|---|---|---|---|---|---|---|---|---|
| 1 | IEX IDEX Corporation | 10/28–12/07 | 40 | 37 | 94.59% | 6.12% | -2.58% | 14043 |
| 2 | MTD Mettler Toledo | 10/23–11/07 | 15 | 28 | 96.43% | 6.74% | -6.41% | 13868 |
| 3 | LII Lennox International | 10/29–12/08 | 40 | 27 | 96.30% | 7.68% | -0.83% | 13076 |
| 4 | ROK Rockwell Automation | 10/28–12/27 | 60 | 44 | 90.91% | 10.10% | -4.84% | 10585 |
| 5 | CSCO Cisco Systems | 10/26–11/05 | 10 | 36 | 88.89% | 4.59% | -1.47% | 10170 |
| 6 | UPS United Parcel Service | 10/31–11/30 | 30 | 26 | 92.31% | 4.87% | -3.97% | 10040 |
| 7 | PH Parker-Hannifin | 10/27–12/06 | 40 | 46 | 89.13% | 8.41% | -2.67% | 10025 |
| 8 | GPC Genuine Parts | 10/27–12/06 | 40 | 46 | 89.13% | 5.08% | -2.48% | 9080 |
| 9 | BLK BlackRock | 10/24–12/23 | 60 | 27 | 85.19% | 9.17% | -2.35% | 8983 |
| 10 | AME AMETEK | 10/27–12/26 | 60 | 42 | 85.71% | 7.43% | -3.78% | 8905 |
IEX, MTD and LII: close Scores, different risks
IEX leads MTD by just 175 points; MTD is 792 points ahead of LII. The next gap is wider: LII leads ROK by 2491 points. These figures describe a statistical ranking, not return probabilities or a linear scale of quality.
IEX combines 35 winning outcomes out of 37 observations with a 6.12% average profit and -2.58% average negative outcome over 40 days. This is historically interesting, but the losing sample comprises only two cases. MTD concentrates a 6.74% average return in 15 days, with 27 wins out of 28: its -6.41% average loss comes from a single outcome. LII, with 26 wins out of 27, also has only one losing observation: -0.83% must not be mistaken for a future risk limit.
Duration and sample depth matter
CSCO offers a relatively balanced historical combination: a short 10-day window, 36 observations, 88.89% win rate, 4.59% average profit and -1.47% average negative. Its losing sample is nevertheless limited to four cases. PH, with 46 observations, combines an 8.41% average profit and -2.67% average negative over 40 days; GPC shares its duration and win rate, but has a lower average return of 5.08%.
ROK exceeds a 10% historical average profit, but requires 60 days and has a -4.84% average loss. BLK and AME also use 60-day windows. Comparing their returns with CSCO without considering exposure time would be misleading; these are not annualised returns. Six of the ten stocks are classified as Industrials by the screener: sector concentration warrants attention and is not diversification.
Top 10 Short patterns by Score
| # | Stock | Window | Days | Sample | Win rate | Avg profit | Avg negative | Score |
|---|---|---|---|---|---|---|---|---|
| 1 | TGT Target Corp | 10/22–10/27 | 5 | 53 | 71.70% | 1.82% | -2.16% | 3515 |
| 2 | WSM Williams-Sonoma | 10/22–10/27 | 5 | 43 | 74.42% | 1.71% | -2.77% | 3381 |
| 3 | DVA DaVita | 10/20–10/30 | 10 | 30 | 70.00% | 2.80% | -3.49% | 3145 |
| 4 | YUM Yum Brands | 10/21–10/26 | 5 | 29 | 72.41% | 0.98% | -1.61% | 3051 |
| 5 | WMB Williams | 10/21–10/26 | 5 | 44 | 70.45% | 1.83% | -2.57% | 2992 |
| 6 | HSIC Henry Schein | 10/22–10/27 | 5 | 30 | 70.00% | 1.63% | -2.30% | 2941 |
| 7 | CAG Conagra Brands | 10/22–10/27 | 5 | 46 | 73.91% | 1.26% | -2.22% | 2916 |
| 8 | MKC McCormick | 10/22–10/27 | 5 | 53 | 77.36% | 1.12% | -2.69% | 2811 |
| 9 | COF Capital One Financial | 11/09–11/19 | 10 | 31 | 74.19% | 2.10% | -3.23% | 2683 |
| 10 | DVN Devon Energy | 10/25–10/30 | 5 | 41 | 70.73% | 1.43% | -2.80% | 2678 |
TGT remains first at 3515, ahead of WSM at 3381, a gap of 134 points. Both cover October 22–27, with 53 and 43 observations respectively. TGT shows 1.82% average profit versus -2.16% average negative; WSM shows 1.71% versus -2.77%. Their platform metrics are more modest than those of the Long leaders; they are not automatically effective hedges.
DVA has the highest average profit in the Short top 10 (2.80%), but its win rate sits exactly at the 70% threshold, with 30 observations and -3.49% average negative. MKC has the group’s highest win rate (77.36%), but only 1.12% average profit against -2.69% in losing outcomes. Win frequency alone is insufficient. COF, ninth at 2683, starts in November, 28 days away, rather than in this week’s calendar.
Changes since October 5
Long results increase from 334 to 336; Short results remain at 38. The Long top 10 has no entries, exits, rank changes or Score changes, and its windows are unchanged. This update confirms the same patterns without providing evidence that they have strengthened.
In the Short ranking, COF enters ninth and TECH leaves the top 10. WSM rises from fourth to second, DVA from fifth to third, YUM from sixth to fourth and WMB from seventh to fifth, all at unchanged Scores. CAG moves from eighth to seventh and MKC from ninth to eighth; TGT and DVN remain first and tenth.
HSIC falls from second to sixth, from 3478 to 2941 (-537 points), but these are different windows: October 8–13 in the previous report versus October 22–27 now. This is not evidence of deterioration in the same pattern. Expired starting dates alter the available selection.
Daily calendar: October 12–18
For each starting date, we show up to two leading results per side by Score, selected after reading all 336 Long rows and 38 Short rows. The calendar groups today’s screening results by start date; it is not a separate independent backtest for every day.
| Start | Long · Score | Short · Score |
|---|---|---|
| 10/12 | SO · 7460 10/12–10/22 · 10 days · n=44 Win 77.27% · avg 1.82% · neg. -0.73% ZBRA · 7303 10/12–12/01 · 50 days · n=35 Win 82.86% · avg 10.35% · neg. -7.22% | No returned result |
| 10/13 | EQIX · 4211 10/13–11/07 · 25 days · n=26 Win 73.08% · avg 5.09% · neg. -4.85% AEP · 3329 10/13–11/02 · 20 days · n=64 Win 71.88% · avg 2.15% · neg. -2.72% | No returned result |
| 10/14 | DGX · 6389 10/14–12/08 · 55 days · n=29 Win 82.76% · avg 6.92% · neg. -6.24% | No returned result |
| 10/15 | YUM · 7519 10/15–11/29 · 45 days · n=29 Win 89.66% · avg 6.75% · neg. -3.76% PG · 5591 10/15–11/29 · 45 days · n=64 Win 76.56% · avg 4.36% · neg. -3.23% | No returned result |
| 10/16 | No returned result | BXP · 2677 10/16–10/21 · 5 days · n=29 Win 72.41% · avg 0.80% · neg. -1.86% CRL · 2593 10/16–11/05 · 20 days · n=26 Win 73.08% · avg 2.60% · neg. -6.18% |
| 10/17 * | STLD · 7838 10/17–11/06 · 20 days · n=29 Win 82.76% · avg 7.29% · neg. -5.19% SBUX · 6090 10/17–12/06 · 50 days · n=34 Win 82.35% · avg 7.92% · neg. -8.47% | TAP · 2410 10/17–10/27 · 10 days · n=51 Win 70.59% · avg 1.74% · neg. -3.76% FIS · 2303 10/17–11/06 · 20 days · n=25 Win 72.00% · avg 1.98% · neg. -4.37% |
| 10/18 * | BRO · 2812 10/18–12/02 · 45 days · n=45 Win 71.11% · avg 5.19% · neg. -6.55% | ALL · 1973 10/18–10/28 · 10 days · n=33 Win 75.76% · avg 1.69% · neg. -6.14% UDR · 1366 10/18–11/02 · 15 days · n=46 Win 71.74% · avg 0.91% · neg. -4.14% |
Reading the week
Monday 12: SO (7460) leads ZBRA (7303) by 157 points, but the profiles differ substantially. Southern spans 10 days with -0.73% average negative over 44 observations; Zebra spans 50 days, offers a much higher historical average profit (10.35%) and has -7.22% average negative. Close Scores do not imply equal risks.
Tuesday and Wednesday: EQIX (4211) leads AEP (3329), but has 26 observations versus 64 and a larger average loss. DGX (6389) leads October 14 with a 55-day window: its 6.92% average profit must be read alongside -6.24% average negative and 29 observations.
Thursday 15: YUM (7519) leads PG (5591) by 1928 points. Both span 45 days, but PG has 64 observations versus 29. YUM also appears in the Short ranking starting October 21: overlapping windows illustrate why a longer positive seasonal pattern does not exclude a few weak days.
Friday 16: no Long result is returned for this starting date; on the Short side, BXP (2677) leads CRL (2593) by just 84 points. BXP averages 0.80% over five days against -1.86% in losing outcomes, making execution costs particularly relevant. CRL extends exposure to 20 days and has a -6.18% average negative.
Weekend: STLD (7838) is the highest-scoring Long starting during the week, ahead of SBUX (6090) for October 17. TAP leads that day’s Shorts at 2410, with a 70.59% win rate and -3.76% average negative. On Sunday, BRO scores 2812, while ALL leads Shorts at 1973: its 75.76% win rate coexists with -6.14% average losses and an overall average profit of 1.69%.
* Non-trading dates: October 17 and 18 fall on the weekend. We retain the platform’s dates without arbitrarily moving them to the preceding or following session. The execution convention must be checked before use. “No returned result” means absence from today’s selection, not proof that no other seasonal pattern exists.
Method, limitations and conclusion
Source: SeasonHunter Screener, accessed on October 12, 2026 through the authenticated session. Starting Date October 12, 2026; US · S&P 500; All Sectors; at least 25 historical years; length 5–60 days; minimum win rate 70%. Long and Short filters were run separately with Sort By Score, and global SCORE ▼ order was verified across pages.
Sample size reproduces the “Trades” column. Win rate is an observed historical frequency; average negative is the mean of losing outcomes, not maximum drawdown or maximum loss. Score is the platform’s ranking criterion, not a probability. We do not assume costs, slippage or stock borrow are included. Selecting among numerous windows creates overfitting risk; short selling also entails specific risks, including potentially unlimited losses.
Monday’s reading is therefore one of continuity among Long leaders and rotation among Shorts. For nearby starts, distinguish SO’s shorter, historically milder profile from the longer YUM and STLD windows, without treating a historical ranking as a standalone trading signal.
Have a good week
Gandalf Project R&D Team
Explore seasonality with SeasonHunter. Register for free at www.seasonhunter.com and use the screeners for 14 days with the dedicated reader offer.
Register for freeImportant notice — Not financial advice
Educational and informational content only. Historical statistics do not guarantee future results. This report is not a personalised recommendation, solicitation or offer to buy or sell financial instruments.
