
Stagionalità del lunedì: IEX e MTD resistono, LII accelera
Esplora le stagionalità con SeasonHunter. Registrati gratuitamente su www.seasonhunter.com e utilizza gli screener per 14 giorni con l’offerta dedicata ai lettori.
Registrati gratuitamente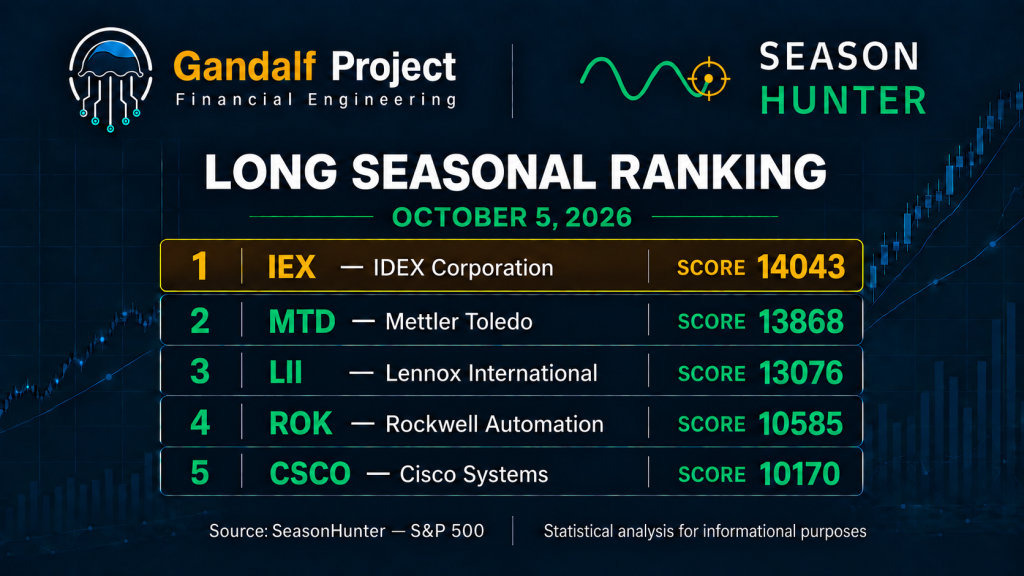
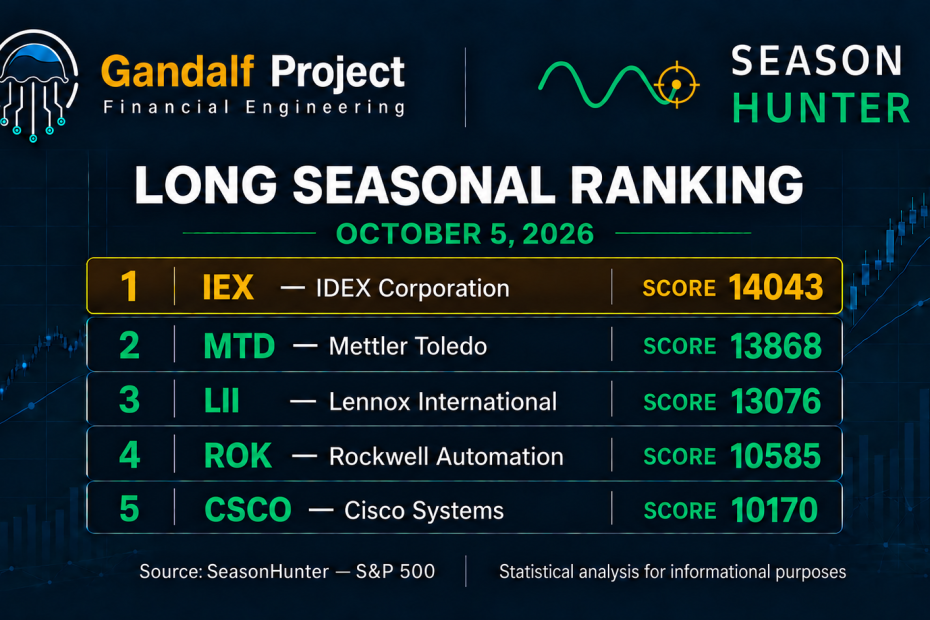
Il nuovo screening restituisce 334 risultati Long e 38 Short: dodici Long in più e otto Short in meno rispetto al 28 settembre. IEX mantiene il primo posto a 14043, seguito da MTD a 13868. La novità è LII, che sale a 13076 e si avvicina alla coppia di testa.
Il vantaggio dei Long riguarda la graduatoria storica restituita dai filtri. Le migliori finestre assolute si aprono fra il 23 e il 31 ottobre; per le partenze imminenti occorre leggere separatamente il calendario del 5–11 ottobre.
Top 10 Long per Score
| Titolo | Finestra | Giorni | Campione | Successo | Profitto medio | Media negativa | Score |
|---|---|---|---|---|---|---|---|
| IEX IDEX Corporation | 28 ott–7 dic | 40 | 37 | 94,59% | 6,12% | -2,58% | 14043 |
| MTD Mettler Toledo | 23 ott–7 nov | 15 | 28 | 96,43% | 6,74% | -6,41% | 13868 |
| LII Lennox International | 29 ott–8 dic | 40 | 27 | 96,30% | 7,68% | -0,83% | 13076 |
| ROK Rockwell Automation | 28 ott–27 dic | 60 | 44 | 90,91% | 10,10% | -4,84% | 10585 |
| CSCO Cisco Systems | 26 ott–5 nov | 10 | 36 | 88,89% | 4,59% | -1,47% | 10170 |
| UPS United Parcel Service | 31 ott–30 nov | 30 | 26 | 92,31% | 4,87% | -3,97% | 10040 |
| PH Parker-Hannifin | 27 ott–6 dic | 40 | 46 | 89,13% | 8,41% | -2,67% | 10025 |
| GPC Genuine Parts | 27 ott–6 dic | 40 | 46 | 89,13% | 5,08% | -2,48% | 9080 |
| BLK BlackRock | 24 ott–23 dic | 60 | 27 | 85,19% | 9,17% | -2,35% | 8983 |
| AME AMETEK | 27 ott–26 dic | 60 | 42 | 85,71% | 7,43% | -3,78% | 8905 |
LII cresce, ma il campione negativo è molto piccolo
IEX precede MTD di 175 punti; LII segue MTD a 792 punti e distanzia ROK di 2491. Sono sette i Long sopra quota 10000. IEX conserva il 94,59% di successi su 37 osservazioni, con profitto medio del 6,12% in 40 giorni e media negativa del -2,58%.
MTD combina una finestra di 15 giorni con il 96,43% di successi su 28 osservazioni. Questa percentuale corrisponde a 27 esiti positivi e uno negativo: il -6,41% medio negativo descrive quindi un solo caso. Anche LII, con il 96,30% su 27 osservazioni, conta un unico esito negativo. Il suo -0,83% è favorevole nel campione, ma non consente di stimare con precisione la perdita di un futuro anno sfavorevole.
CSCO offre un profilo compatto: dieci giorni, 36 osservazioni, 88,89% di successi e +4,59% medio contro -1,47% nelle annate negative. ROK mostra il profitto medio più elevato della top ten, +10,10%, ma su 60 giorni. PH e GPC dispongono entrambi di 46 osservazioni e medie negative rispettivamente del -2,67% e -2,48%. Confrontare rendimenti su durate diverse richiede cautela: i valori riportati non sono annualizzati.
Top 10 Short per Score
| Titolo | Finestra | Giorni | Campione | Successo | Profitto medio | Media negativa | Score |
|---|---|---|---|---|---|---|---|
| TGT Target | 22 ott–27 ott | 5 | 53 | 71,70% | 1,82% | -2,16% | 3515 |
| HSIC Henry Schein | 8 ott–13 ott | 5 | 30 | 73,33% | 1,16% | -1,80% | 3478 |
| TECH Bio-Techne | 5 ott–10 ott | 5 | 37 | 70,27% | 1,76% | -2,14% | 3403 |
| WSM Williams-Sonoma | 22 ott–27 ott | 5 | 43 | 74,42% | 1,71% | -2,77% | 3381 |
| DVA DaVita | 20 ott–30 ott | 10 | 30 | 70,00% | 2,80% | -3,49% | 3145 |
| YUM Yum! Brands | 21 ott–26 ott | 5 | 29 | 72,41% | 0,98% | -1,61% | 3051 |
| WMB Williams | 21 ott–26 ott | 5 | 44 | 70,45% | 1,83% | -2,57% | 2992 |
| CAG Conagra Brands | 22 ott–27 ott | 5 | 46 | 73,91% | 1,26% | -2,22% | 2916 |
| MKC McCormick | 22 ott–27 ott | 5 | 53 | 77,36% | 1,12% | -2,69% | 2811 |
| DVN Devon Energy | 25 ott–30 ott | 5 | 41 | 70,73% | 1,43% | -2,80% | 2678 |
TGT guida a 3515, appena 37 punti sopra HSIC. TECH segue a 3403 e WSM a 3381: fra il primo e il quarto ci sono soltanto 134 punti. Tutti i primi dieci restano sotto quota 3600, con win rate compresi fra 70% e 77,36%.
TECH è in partenza oggi; HSIC apre l’8 ottobre. TGT, invece, parte il 22 ottobre. DVA ha il rendimento medio più alto della top ten Short, +2,80%, ma anche la media negativa più ampia, -3,49%, su una durata doppia rispetto alle altre nove finestre. YUM presenta la perdita media negativa più contenuta (-1,61%), insieme al profitto medio più basso (+0,98%).
Due orizzonti diversi. IEX supera TGT di 10528 punti di Score. È un confronto fra punteggi dello screener, non una misura del rendimento futuro o della probabilità di successo. Per le partenze di oggi, i leader sono JKHY Long a 4526 e TECH Short a 3403.
Ranking giornaliero: 5–11 ottobre
Per ogni data selezioniamo il primo per Score tra i risultati dello screening aventi quella partenza. Ogni cella riporta Score, uscita, durata, numerosità, win rate, profitto medio e media negativa. “Nessun risultato” significa che nessuna riga restituita presenta quella partenza, non che sia stata esclusa ogni possibile strategia su quella data.
| Partenza | Miglior Long | Miglior Short |
|---|---|---|
| 5 ottobre | JKHY · 4526 Uscita 24 nov · 50 giorni · n=40 80,00% · 8,48% / -7,47% | TECH · 3403 Uscita 10 ott · 5 giorni · n=37 70,27% · 1,76% / -2,14% |
| 6 ottobre | EXPD · 4010 Uscita 5 dic · 60 giorni · n=42 76,19% · 7,05% / -7,08% | MDLZ · 2636 Uscita 11 ott · 5 giorni · n=25 72,00% · 1,16% / -1,59% |
| 7 ottobre | ORLY · 7337 Uscita 6 dic · 60 giorni · n=33 78,79% · 9,47% / -2,32% | Nessun risultato con questa partenza |
| 8 ottobre | J · 2639 Uscita 2 dic · 55 giorni · n=46 71,74% · 5,32% / -11,76% | HSIC · 3478 Uscita 13 ott · 5 giorni · n=30 73,33% · 1,16% / -1,80% |
| 9 ottobre | AZO · 7792 Uscita 8 dic · 60 giorni · n=35 82,86% · 10,49% / -4,07% | Nessun risultato con questa partenza |
| 10 ottobre | RSG · 7346 Uscita 9 dic · 60 giorni · n=28 85,71% · 5,00% / -4,37% | Nessun risultato con questa partenza |
| 11 ottobre | APH · 8403 Uscita 5 nov · 25 giorni · n=34 94,12% · 7,58% / -8,85% | Nessun risultato con questa partenza |
APH guida la settimana, ORLY e AZO meritano un confronto
APH, in partenza l’11 ottobre, è il leader settimanale a 8403: 94,12% di successi su 34 osservazioni, ma una media negativa del -8,85%, ricavata da due esiti sfavorevoli. AZO del 9 ottobre raggiunge 7792, con +10,49% medio e -4,07% negativo. ORLY del 7 ottobre offre +9,47% medio e -2,32% negativo su 33 osservazioni: un rapporto storico interessante, accompagnato però da 60 giorni di esposizione.
JKHY apre oggi una finestra di 50 giorni con +8,48% medio e -7,47% negativo. EXPD, il 6 ottobre, presenta valori medi positivi e negativi quasi speculari (+7,05% e -7,08%). J dell’8 ottobre è più debole: Score 2639 e -11,76% medio negativo contro +5,32% complessivo. Sul fronte Short emergono solo TECH, MDLZ e HSIC nei giorni 5, 6 e 8.
Le date del 10 e 11 ottobre cadono nel fine settimana: sono riportate come nello screener. Prima di un eventuale utilizzo occorre verificare la convenzione con cui la piattaforma gestisce le sedute non negoziabili.
Che cosa cambia rispetto al 28 settembre
I risultati Long aumentano da 322 a 334 (+3,7%) e gli Short diminuiscono da 46 a 38 (-17,4%). La top ten Long conserva tutti i componenti. IEX e MTD mantengono posizione e Score; LII sale dal quarto al terzo posto, da 10338 a 13076 (+2738), con finestra spostata dal 28 ottobre–7 dicembre al 29 ottobre–8 dicembre. ROK passa dal terzo al quarto posto a Score invariato.
UPS sale dal settimo al sesto posto e da 9777 a 10040 (+263), ma cambia finestra: dal 12 ottobre–1 dicembre al 31 ottobre–30 novembre, riducendo la durata da 50 a 30 giorni. PH scende dal sesto al settimo a Score invariato. Negli Short escono DGX, RMD e INTU, le cui precedenti partenze erano in settembre; entrano CAG, MKC e DVN. TGT sale dal secondo al primo posto senza variazioni del proprio Score.
Questi movimenti confrontano le configurazioni selezionate in due date diverse. Un aumento dello Score può derivare dal cambio di finestra: non va interpretato automaticamente come miglioramento della stessa strategia o del titolo sul mercato.
Metodo e limiti della lettura
Fonte: SeasonHunter Screener, consultato il 5 ottobre 2026. Starting Date 2026-10-05; tutti gli altri filtri sono indicati in apertura. Long e Short sono stati eseguiti separatamente e verificati con SCORE ▼ su tutti i risultati. Il calendario deriva dal raggruppamento delle righe per data iniziale.
La numerosità corrisponde alla colonna “Trades” dello screener. Il win rate descrive la frequenza storica osservata; la media negativa è la media degli esiti sfavorevoli, non il massimo drawdown né una perdita massima. Lo Score è un criterio di ranking della piattaforma e non una probabilità. Costi, slippage, prestito titoli e rischio delle vendite allo scoperto vanno valutati a parte; il report non presume che siano inclusi. La selezione fra molte finestre introduce inoltre un rischio di sovraottimizzazione.

Buona settimana
Gandalf Project R&D Team
Esplora le stagionalità con SeasonHunter. Registrati gratuitamente su www.seasonhunter.com e utilizza gli screener per 14 giorni con l’offerta dedicata ai lettori.
Registrati gratuitamenteAvvertenza importante — Non è consulenza finanziaria
Contenuti a scopo educativo e informativo. Le statistiche storiche non garantiscono risultati futuri. Il report non costituisce una raccomandazione personalizzata, una sollecitazione o un’offerta di acquisto o vendita di strumenti finanziari.
Monday seasonality: IEX and MTD hold the lead as LII advances
Explore seasonality with SeasonHunter. Register for free at www.seasonhunter.com and use the screeners for 14 days with the dedicated reader offer.
Register for freeThe new screen returns 334 Long and 38 Short results: twelve more Longs and eight fewer Shorts than on September 28. IEX remains first at 14043, followed by MTD at 13868. LII is the main mover, rising to 13076 and closing in on the leading pair.
The Long advantage refers to the historical ranking returned by these filters. The top windows start between October 23 and 31; imminent starts require a separate reading of the October 5–11 calendar.
Top 10 Longs by Score
| Stock | Window | Days | Sample | Win rate | Avg profit | Avg negative | Score |
|---|---|---|---|---|---|---|---|
| IEX IDEX Corporation | Oct 28–Dec 7 | 40 | 37 | 94.59% | 6.12% | -2.58% | 14043 |
| MTD Mettler Toledo | Oct 23–Nov 7 | 15 | 28 | 96.43% | 6.74% | -6.41% | 13868 |
| LII Lennox International | Oct 29–Dec 8 | 40 | 27 | 96.30% | 7.68% | -0.83% | 13076 |
| ROK Rockwell Automation | Oct 28–Dec 27 | 60 | 44 | 90.91% | 10.10% | -4.84% | 10585 |
| CSCO Cisco Systems | Oct 26–Nov 5 | 10 | 36 | 88.89% | 4.59% | -1.47% | 10170 |
| UPS United Parcel Service | Oct 31–Nov 30 | 30 | 26 | 92.31% | 4.87% | -3.97% | 10040 |
| PH Parker-Hannifin | Oct 27–Dec 6 | 40 | 46 | 89.13% | 8.41% | -2.67% | 10025 |
| GPC Genuine Parts | Oct 27–Dec 6 | 40 | 46 | 89.13% | 5.08% | -2.48% | 9080 |
| BLK BlackRock | Oct 24–Dec 23 | 60 | 27 | 85.19% | 9.17% | -2.35% | 8983 |
| AME AMETEK | Oct 27–Dec 26 | 60 | 42 | 85.71% | 7.43% | -3.78% | 8905 |
LII advances, but its losing sample is very small
IEX leads MTD by 175 points; LII is 792 behind MTD and 2491 ahead of ROK. Seven Longs exceed 10000. IEX retains a 94.59% win rate across 37 observations, a 6.12% average profit over 40 days and a -2.58% average negative result.
MTD combines a 15-day window with a 96.43% win rate across 28 observations. This corresponds to 27 winning outcomes and one losing outcome: its -6.41% average loss therefore describes a single case. LII’s 96.30% across 27 observations likewise includes just one loss. Its -0.83% is favourable within the sample, but offers little precision about a future losing year’s outcome.
CSCO offers a compact profile: ten days, 36 observations, an 88.89% win rate and +4.59% average profit against -1.47% in losing years. ROK has the highest average profit in the top ten at +10.10%, over 60 days. PH and GPC both have 46 observations, with average negative results of -2.67% and -2.48%. Returns across different holding periods require care: these figures are not annualised.
Top 10 Shorts by Score
| Stock | Window | Days | Sample | Win rate | Avg profit | Avg negative | Score |
|---|---|---|---|---|---|---|---|
| TGT Target | Oct 22–Oct 27 | 5 | 53 | 71.70% | 1.82% | -2.16% | 3515 |
| HSIC Henry Schein | Oct 8–Oct 13 | 5 | 30 | 73.33% | 1.16% | -1.80% | 3478 |
| TECH Bio-Techne | Oct 5–Oct 10 | 5 | 37 | 70.27% | 1.76% | -2.14% | 3403 |
| WSM Williams-Sonoma | Oct 22–Oct 27 | 5 | 43 | 74.42% | 1.71% | -2.77% | 3381 |
| DVA DaVita | Oct 20–Oct 30 | 10 | 30 | 70.00% | 2.80% | -3.49% | 3145 |
| YUM Yum! Brands | Oct 21–Oct 26 | 5 | 29 | 72.41% | 0.98% | -1.61% | 3051 |
| WMB Williams | Oct 21–Oct 26 | 5 | 44 | 70.45% | 1.83% | -2.57% | 2992 |
| CAG Conagra Brands | Oct 22–Oct 27 | 5 | 46 | 73.91% | 1.26% | -2.22% | 2916 |
| MKC McCormick | Oct 22–Oct 27 | 5 | 53 | 77.36% | 1.12% | -2.69% | 2811 |
| DVN Devon Energy | Oct 25–Oct 30 | 5 | 41 | 70.73% | 1.43% | -2.80% | 2678 |
TGT leads at 3515, only 37 points ahead of HSIC. TECH follows at 3403 and WSM at 3381: first and fourth are separated by just 134 points. All ten remain below 3600, with win rates ranging from 70% to 77.36%.
TECH starts today and HSIC on October 8, while TGT starts on October 22. DVA has the highest average profit at +2.80%, but also the largest average loss at -3.49%, over twice the holding period of the other nine windows. YUM has the smallest average loss (-1.61%) and the lowest average profit (+0.98%).
Two different horizons. IEX leads TGT by 10528 Score points. This compares platform scores, rather than measuring future returns or success probabilities. For starts today, the leaders are JKHY Long at 4526 and TECH Short at 3403.
Daily ranking: October 5–11
For each date, we select the highest Score among returned results starting that day. Each cell shows Score, exit, duration, sample size, win rate, average profit and average negative result. “No returned result” refers to this screen’s rows and does not rule out every possible strategy starting on that date.
| Start | Best Long | Best Short |
|---|---|---|
| Oct 5 | JKHY · 4526 End Nov 24 · 50 days · n=40 80.00% · 8.48% / -7.47% | TECH · 3403 End Oct 10 · 5 days · n=37 70.27% · 1.76% / -2.14% |
| Oct 6 | EXPD · 4010 End Dec 5 · 60 days · n=42 76.19% · 7.05% / -7.08% | MDLZ · 2636 End Oct 11 · 5 days · n=25 72.00% · 1.16% / -1.59% |
| Oct 7 | ORLY · 7337 End Dec 6 · 60 days · n=33 78.79% · 9.47% / -2.32% | No returned result with this start |
| Oct 8 | J · 2639 End Dec 2 · 55 days · n=46 71.74% · 5.32% / -11.76% | HSIC · 3478 End Oct 13 · 5 days · n=30 73.33% · 1.16% / -1.80% |
| Oct 9 | AZO · 7792 End Dec 8 · 60 days · n=35 82.86% · 10.49% / -4.07% | No returned result with this start |
| Oct 10 | RSG · 7346 End Dec 9 · 60 days · n=28 85.71% · 5.00% / -4.37% | No returned result with this start |
| Oct 11 | APH · 8403 End Nov 5 · 25 days · n=34 94.12% · 7.58% / -8.85% | No returned result with this start |
APH leads the week; ORLY and AZO deserve comparison
APH, starting October 11, leads the week at 8403: a 94.12% win rate across 34 observations, but a -8.85% average loss based on two losing outcomes. AZO on October 9 reaches 7792, with +10.49% average profit and -4.07% average loss. ORLY on October 7 offers +9.47% average profit and -2.32% average loss across 33 observations, an interesting historical balance alongside 60 days of exposure.
JKHY opens a 50-day window today with +8.48% average profit and -7.47% average loss. EXPD on October 6 has almost symmetrical averages (+7.05% and -7.08%). J on October 8 is weaker: a 2639 Score and -11.76% average loss against +5.32% overall average profit. The Short calendar contains only TECH, MDLZ and HSIC on October 5, 6 and 8.
October 10 and 11 fall on a weekend; dates are reproduced as shown by the screener. Before any use, check the platform’s convention for non-trading sessions.
Changes since September 28
Long results rise from 322 to 334 (+3.7%), while Shorts fall from 46 to 38 (-17.4%). All Long top-ten members remain. IEX and MTD retain their rank and Score; LII moves from fourth to third, from 10338 to 13076 (+2738), with its window shifting from October 28–December 7 to October 29–December 8. ROK moves from third to fourth at an unchanged Score.
UPS advances from seventh to sixth and from 9777 to 10040 (+263), but its window changes from October 12–December 1 to October 31–November 30, shortening from 50 to 30 days. PH drops from sixth to seventh at an unchanged Score. Among Shorts, DGX, RMD and INTU leave, with their previous starts in September; CAG, MKC and DVN enter. TGT rises from second to first with no Score change.
These movements compare configurations selected on different screening dates. A Score increase can reflect a changed window and does not automatically mean the same strategy or stock has improved.
Method and interpretation limits
Source: SeasonHunter Screener, accessed October 5, 2026. Starting Date 2026-10-05; other filters are listed above. Long and Short were run separately and verified in SCORE ▼ order across all results. The daily calendar groups returned rows by start date.
Sample size reproduces the screener’s “Trades” column. Win rate is an observed historical frequency; average negative is the mean of losing outcomes, not maximum drawdown or maximum loss. Score is the platform’s ranking criterion, not a probability. Costs, slippage, stock borrow and short-selling risks require separate assessment; this report does not assume they are included. Selecting among many windows also creates overfitting risk.
Have a good week
Gandalf Project R&D Team
Explore seasonality with SeasonHunter. Register for free at www.seasonhunter.com and use the screeners for 14 days with the dedicated reader offer.
Register for freeImportant notice — Not financial advice
Educational and informational content only. Historical statistics do not guarantee future results. This report is not a personalised recommendation, solicitation or offer to buy or sell financial instruments.
