
Corn Futures (ZC), il rialzo stagionale dopo la raccolta
Il primo futures del ranking Long
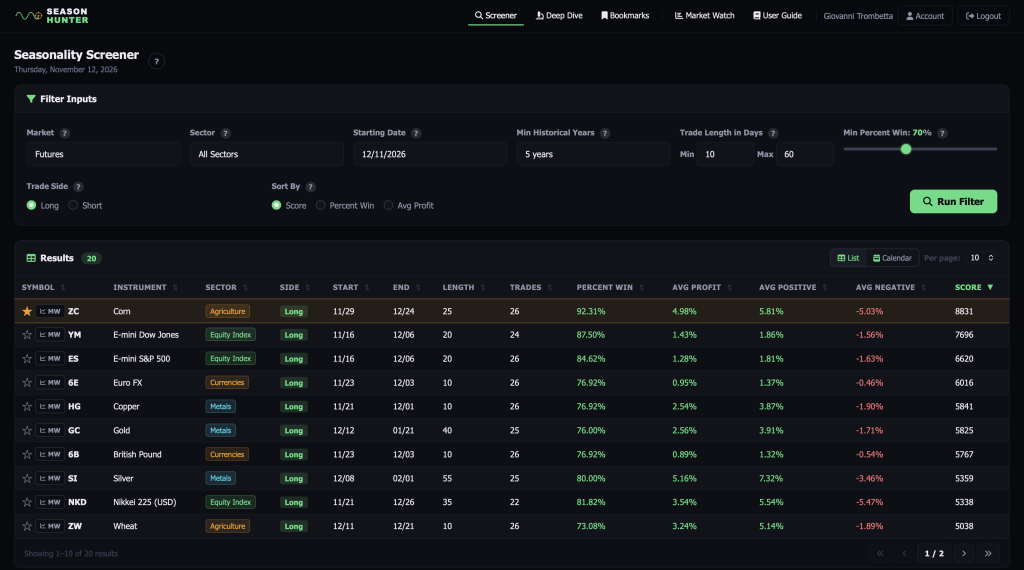
Il 12 novembre 2026 il Corn (ZC) occupava il primo posto per Score tra i 20 risultati dello screener Futures Long di SeasonHunter. Il filtro copriva tutti i settori, con finestre da 10 a 60 giorni, almeno cinque anni di storico e una percentuale minima di esiti positivi del 70%. Il mais ottiene 8.831 punti per la finestra dal 29 novembre al 24 dicembre, lunga 25 giorni di calendario. La riga riporta 26 osservazioni, il 92,31% di esiti positivi e un rendimento medio del +4,98%. Le operazioni positive valgono in media +5,81%, quelle negative −5,03%. La perdita media ha quindi un’ampiezza vicina al guadagno medio: la frequenza degli esiti positivi è la caratteristica che spicca nella scheda.
Il rialzo prende forma a dicembre
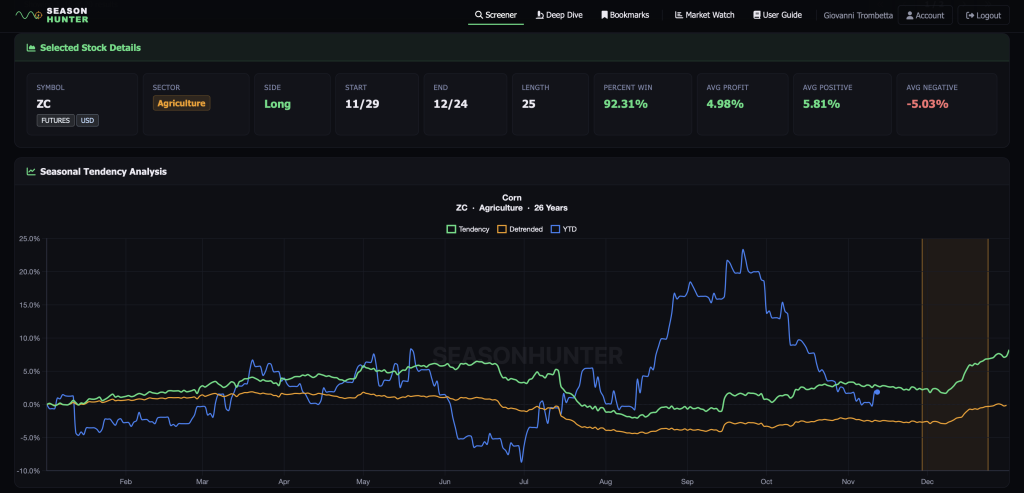
Nella curva storica su 26 anni, il prezzo medio stagionale è quasi piatto all’inizio della fascia evidenziata e sale più nettamente nella seconda parte di dicembre. Anche la linea depurata dal trend risale in quella fase. La linea blu mostra invece il percorso del 2026 fino alla rilevazione, dopo un picco tra settembre e ottobre e un ampio rientro. Nel Corn Belt la finestra cade dopo il grosso della raccolta autunnale. Quando si attenuano le consegne legate al raccolto, la disponibilità immediata dipende di più da quanto mais gli operatori scelgono di vendere o tenere in magazzino. Il differenziale tra prezzo fisico locale e future, detto basis, e lo spread dicembre–marzo aiutano a distinguere la pressione sul fisico dal movimento del future. È un’interpretazione di mercato compatibile con il grafico. Le curve, da sole, non stabiliscono la causa del rialzo.
Quanto contano ingresso e durata
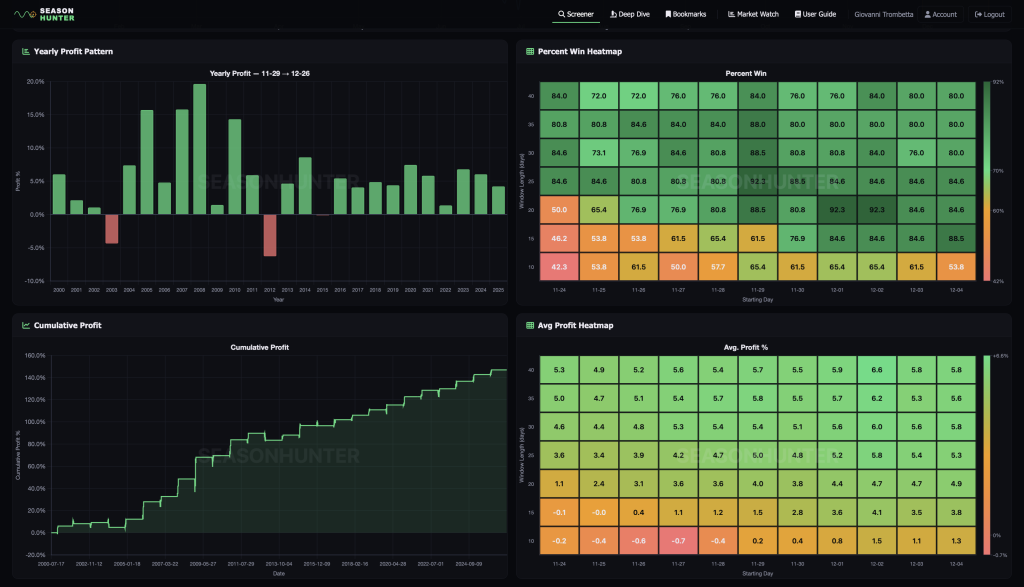
Con ingresso il 29 novembre, passare da 10 a 25 giorni porta la frequenza positiva dal 65,4% al 92,3% e il rendimento medio dal +0,2% al +5,0%. Iniziando il 1° o il 2 dicembre e restando per 20 giorni, la frequenza è ancora del 92,3%, con medie rispettivamente del +4,4% e del +4,7%. Il 2 dicembre a 40 giorni ha la media più alta tra le celle mostrate (+6,6%), con l’84,0% di esiti positivi e una finestra che arriva a gennaio. Le finestre si sovrappongono e condividono gran parte dello storico. Le mappe misurano la sensibilità alle date e alla durata. Il grafico annuale è intestato 29 novembre–26 dicembre, mentre la scheda chiude il 24. La curva cumulata adiacente mostra la progressione del profitto secondo la piattaforma. Le due viste richiedono una verifica della metodologia prima di attribuire la cumulata alla finestra del ranking.
Il rischio che emerge dalle singole operazioni
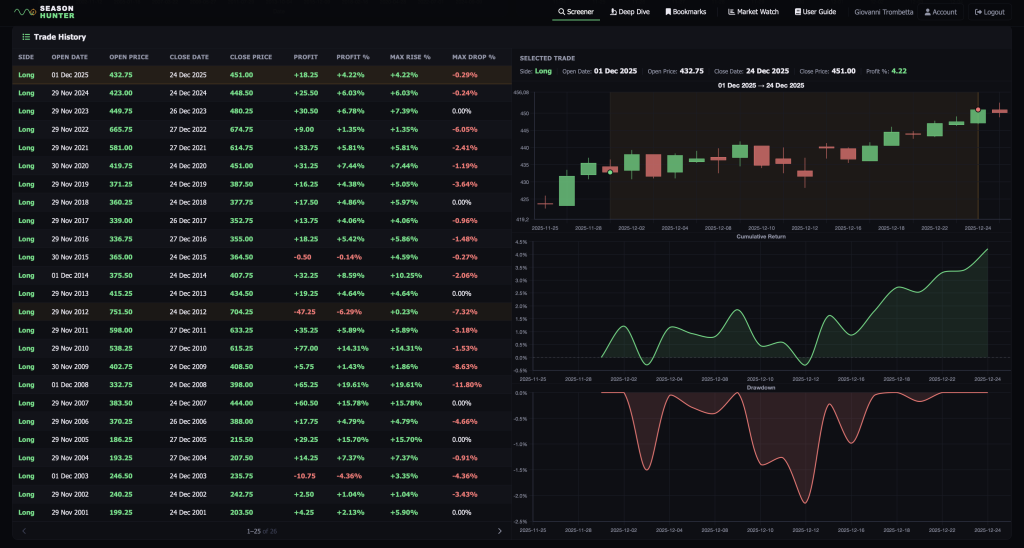
Nel 2025 la rilevazione va dal 1° al 24 dicembre, da 432,75 a 451,00 centesimi per bushel, pari al +4,22%. La discesa massima rispetto all’ingresso riportata in tabella è −0,29%. Il grafico del drawdown scende invece a circa −2,1% rispetto a un massimo maturato durante l’operazione. Nel 2008 il risultato finale è +19,61% dopo un’escursione avversa dell’11,80%, mentre il 2012 chiude a −6,29%. La tabella mostra almeno tre chiusure negative (2003, 2012 e 2015), mentre il 92,31% della scheda equivale a 24 esiti positivi su 26. Le schermate non consentono di riconciliare questa differenza. Per leggere la stagionalità sul mercato negoziabile conta anche la scadenza: ZC vale 5.000 bushel e il dicembre termina le contrattazioni prima del 24. La finestra statistica attraversa quindi il periodo di passaggio al marzo. Per riprodurre il risultato occorrono la scadenza utilizzata, la regola di rollover e il trattamento dei giorni senza seduta, che le tavole non specificano.
SeasonHunter Screener · CME Corn Product Overview · CME Grain Spreads and Storage · CBOT Corn Contract Specifications
Kepler · Gandalf Project
Corn Futures (ZC), the post-harvest seasonal rally
The top-ranked long futures setup
On November 12, 2026, Corn (ZC) ranked first by Score among 20 results in SeasonHunter’s long futures screen. The filter covered all sectors, with windows of 10 to 60 days, at least five years of history and a minimum win rate of 70%. Corn scored 8,831 for the 25-calendar-day window from November 29 to December 24. The screener reports 26 observations, a 92.31% win rate and a +4.98% average return. Winning trades averaged +5.81%, and losing trades averaged −5.03%. The average loss is close in size to the average gain, making the frequency of positive outcomes the standout figure in the screen.
The advance takes shape in December
In the 26-year profile, the seasonal average is nearly flat early in the highlighted window and rises more sharply in the second half of December. The detrended curve also turns higher. The blue line tracks 2026 through the observation date, following a peak around September and October and a substantial retracement. In the Corn Belt, the window falls after the bulk of the autumn harvest. As harvest deliveries slow, nearby physical supply depends more on how much grain operators choose to sell or store. Local cash basis, the difference between the cash price and the relevant futures price, and the December–March spread help distinguish changes in the physical market from moves in the outright futures price. This market interpretation fits the timing of the chart. The curves alone do not establish what drove the advance.
How entry and holding period affect the result
With a November 29 entry, extending the window from 10 to 25 days raises the win rate from 65.4% to 92.3% and the average return from +0.2% to +5.0%. A 20-day window starting December 1 or 2 also shows a 92.3% win rate, with average returns of +4.4% and +4.7%, respectively. The December 2 entry held for 40 days has the highest average in the displayed grid (+6.6%), with an 84.0% win rate and a holding period that extends into January. The windows overlap and share much of the same history. The heatmaps show sensitivity to entry and duration. The yearly chart is labeled November 29–December 26, while the screener gives December 24 as the end date. The adjacent cumulative chart shows the platform’s profit progression. Its calculation needs to be verified before assigning it to the ranked window.
What individual trades reveal about risk
In 2025 the observation ran from December 1 to 24, from 432.75 to 451.00 cents per bushel, for a +4.22% return. The table reports a maximum drop of 0.29% below entry. The drawdown chart reaches about −2.1% from a peak reached during the trade. In 2008 the final return was +19.61% after an 11.80% adverse move, while 2012 ended at −6.29%. The table shows at least three losing closes (2003, 2012 and 2015), while the screener’s 92.31% implies 24 winners out of 26. The screenshots do not reconcile those figures. Contract expiry matters when mapping the pattern to tradable futures: ZC covers 5,000 bushels and the December contract stops trading before December 24. The seasonal window therefore spans the period when trading shifts to March. Reproducing the results requires the contract month, roll rule and treatment of non-trading days, which the screenshots do not specify.
SeasonHunter Screener · CME Corn Product Overview · CME Grain Spreads and Storage · CBOT Corn Contract Specifications
Kepler · Gandalf Project
