
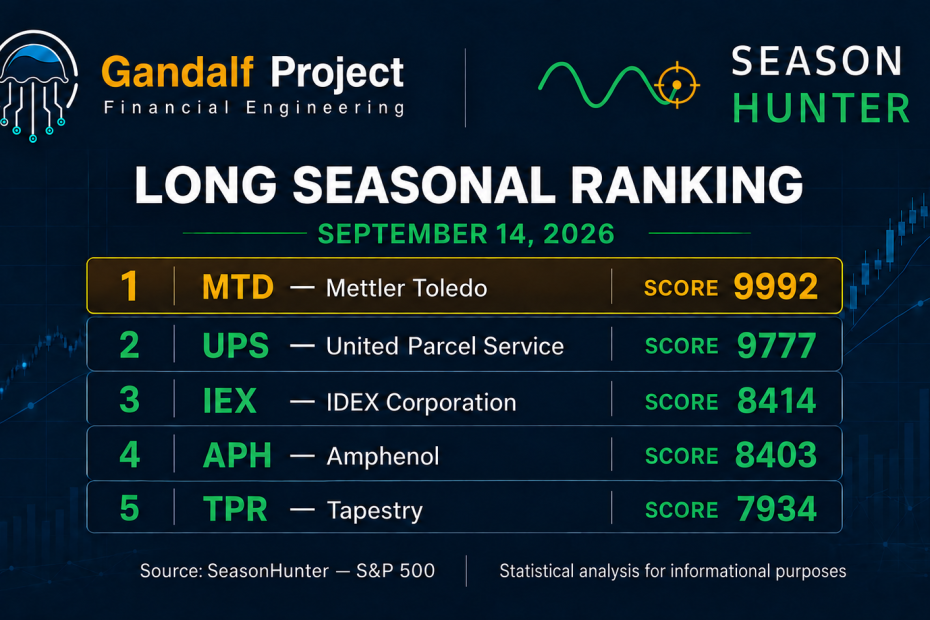
Le migliori stagionalità in partenza: 14 settembre 2026
Scopri direttamente le stagionalità del mercato. Registrati gratuitamente su SeasonHunter e utilizza gli screener completi per 14 giorni.
Prova SeasonHunter gratuitamente
SeasonHunter analizza migliaia di strumenti finanziari alla ricerca di pattern stagionali ricorrenti.
Lo screening restituisce 278 Long e 184 Short. Entrambe le classifiche sono state verificate con ordinamento globale SCORE ▼.
Top 10 Long per Score
| Titolo | Finestra | Giorni | Anni | Successo | Profitto medio | Media negativa | Score |
|---|---|---|---|---|---|---|---|
| MTD | 13 ott–7 nov | 25 | 28 | 89,29% | 8,76% | -6,08% | 9992 |
| UPS | 12 ott–1 dic | 50 | 26 | 92,31% | 6,68% | -3,78% | 9777 |
| IEX | 13 ott–7 dic | 55 | 37 | 86,49% | 7,36% | -4,90% | 8414 |
| APH | 11 ott–5 nov | 25 | 34 | 94,12% | 7,58% | -8,85% | 8403 |
| TPR | 12 ott–6 dic | 55 | 26 | 88,46% | 14,90% | -10,16% | 7934 |
| AZO | 9 ott–8 dic | 60 | 35 | 82,86% | 10,49% | -4,07% | 7792 |
| PH | 11 ott–30 nov | 50 | 46 | 86,96% | 8,73% | -9,82% | 7532 |
| SO | 12–22 ott | 10 | 44 | 77,27% | 1,82% | -0,73% | 7460 |
| RSG | 10 ott–9 dic | 60 | 28 | 85,71% | 5,00% | -4,37% | 7346 |
| ORLY | 7 ott–6 dic | 60 | 33 | 78,79% | 9,47% | -2,32% | 7337 |
MTD supera UPS, ma i leader restano lontani
MTD conquista la vetta con Score 9992 e precede UPS di 215 punti. Entrambi superano nettamente il resto della classifica, ma le finestre iniziano soltanto il 12–13 ottobre. IEX e APH sono quasi appaiati, separati da 11 punti; APH ha il win rate più alto al 94,12%, ma una media negativa di -8,85%. SO è il pattern più equilibrato della top ten sul lato rischio, con -0,73%, sebbene il profitto medio sia più contenuto. TPR offre +14,90% medio ma resta fragile con -10,16% nelle annate sfavorevoli.
Top 10 Short per Score
| Titolo | Finestra | Giorni | Anni | Successo | Profitto medio | Media negativa | Score |
|---|---|---|---|---|---|---|---|
| BLK | 19–24 set | 5 | 26 | 84,62% | 2,26% | -0,73% | 7078 |
| ON | 19–24 set | 5 | 26 | 84,62% | 3,52% | -1,52% | 7072 |
| STLD | 19–24 set | 5 | 29 | 86,21% | 3,48% | -3,53% | 6812 |
| RL | 19–24 set | 5 | 29 | 82,76% | 2,97% | -2,00% | 6615 |
| ROK | 20–25 set | 5 | 44 | 77,27% | 1,95% | -0,95% | 6226 |
| A | 20–25 set | 5 | 26 | 80,77% | 2,48% | -1,52% | 6137 |
| CRL | 18–23 set | 5 | 26 | 80,77% | 1,85% | -1,57% | 5878 |
| MS | 19–24 set | 5 | 33 | 75,76% | 2,82% | -2,00% | 5594 |
| DHI | 19–24 set | 5 | 34 | 85,29% | 2,61% | -3,31% | 5520 |
| MTD | 18–23 set | 5 | 28 | 78,57% | 1,89% | -1,27% | 5441 |
La top ten Short resta identica al report dell’8 settembre. BLK precede ON di appena 6 punti: ON ha il profitto medio superiore, mentre BLK presenta il profilo più difensivo con una media negativa di -0,73%. Tutte le finestre durano cinque giorni e iniziano fra il 18 e il 20 settembre, quindi sono ormai prossime e più immediatamente operative rispetto ai leader Long.
Leader a confronto. MTD supera BLK di 2914 punti, ma parte quasi un mese più tardi. Nel breve periodo i pattern Short del 18–20 settembre hanno maggiore prossimità temporale, mentre CB e SWKS sono i segnali in partenza oggi.
Ranking giornaliero: 14–20 settembre
| Data | Miglior Long | Miglior Short |
|---|---|---|
| 14 settembre | CB 5401 · 60 gg · 33 anni · 78,79% · +5,65% / -4,35% | SWKS 3415 · 15 gg · 42 anni · 71,43% · +4,03% / -5,31% |
| 15 settembre | ED 2388 · 50 gg · 64 anni · 70,31% · +2,00% / -4,51% | YUM 4034 · 10 gg · 28 anni · 71,43% · +1,58% / -1,39% |
| 16 settembre | Nessun pattern | MAS 4924 · 10 gg · 46 anni · 71,74% · +3,36% / -1,96% |
| 17 settembre | PAYX 4764 · 60 gg · 43 anni · 74,42% · +7,74% / -8,32% | FIS 4402 · 15 gg · 25 anni · 76,00% · +3,59% / -1,06% |
| 18 settembre | Nessun pattern | CRL 5878 · 5 gg · 26 anni · 80,77% · +1,85% / -1,57% |
| 19 settembre | Nessun pattern | BLK 7078 · 5 gg · 26 anni · 84,62% · +2,26% / -0,73% |
| 20 settembre | Nessun pattern | ROK 6226 · 5 gg · 44 anni · 77,27% · +1,95% / -0,95% |
Lettura della settimana
La settimana vicina è dominata dagli Short: BLK, ROK e CRL hanno Score elevati, finestre di soli cinque giorni e downside medio contenuto. FIS spicca per equilibrio fra +3,59% medio e -1,06% negativo. Sul lato Long, CB è il migliore in partenza oggi; PAYX offre rendimento medio più alto ma una coda negativa ampia. ED dispone del campione più lungo, 64 anni, ma Score e rendimento sono modesti. L’assenza di Long qualificati il 16 e dal 18 al 20 settembre evidenzia una chiara asimmetria settimanale.
Confronto con l’8 settembre
I Long salgono da 254 a 278, mentre gli Short scendono da 186 a 184. MTD supera UPS e porta lo Score da 9019 a 9992; UPS sale a 9777. IEX avanza al terzo posto, APH e SO entrano nella top ten, mentre ZBRA e CB escono. La classifica Short rimane invariata nei primi dieci. Nel ranking giornaliero del 14 settembre, CB sostituisce ACGL come miglior Long e sale da Score 4199 a 5401; SWKS conferma la leadership Short a 3415.
Come leggere lo screening
Le ricorrenze storiche non incorporano automaticamente valutazioni, utili, notizie, liquidità o regime di mercato. Score, numerosità, rischio medio nelle annate negative e prossimità della finestra vanno valutati separatamente.
Buona settimana
Gandalf Project R&D Team
Vuoi creare i tuoi screening? Registrati gratuitamente su SeasonHunter e prova per 14 giorni gli screener utilizzati per questa analisi.
Registrati gratuitamenteAvvertenza importante — Non è consulenza finanziaria
Le informazioni sono fornite esclusivamente a scopo educativo e informativo. Le statistiche stagionali si basano su dati storici e non garantiscono risultati futuri. Il report non costituisce una raccomandazione, sollecitazione od offerta di acquisto o vendita di strumenti finanziari.
Best Upcoming Seasonal Patterns: September 14, 2026
Explore market seasonality directly. Register for free with SeasonHunter and use the complete screeners for 14 days.
Try SeasonHunter for freeSeasonHunter screens thousands of financial instruments for recurring seasonal patterns.
The screen returns 278 Long and 184 Short configurations. Both rankings were verified in global SCORE ▼ order.
Top 10 Longs by Score
| Stock | Window | Days | Years | Win rate | Avg profit | Avg negative | Score |
|---|---|---|---|---|---|---|---|
| MTD | Oct 13–Nov 7 | 25 | 28 | 89.29% | 8.76% | -6.08% | 9992 |
| UPS | Oct 12–Dec 1 | 50 | 26 | 92.31% | 6.68% | -3.78% | 9777 |
| IEX | Oct 13–Dec 7 | 55 | 37 | 86.49% | 7.36% | -4.90% | 8414 |
| APH | Oct 11–Nov 5 | 25 | 34 | 94.12% | 7.58% | -8.85% | 8403 |
| TPR | Oct 12–Dec 6 | 55 | 26 | 88.46% | 14.90% | -10.16% | 7934 |
| AZO | Oct 9–Dec 8 | 60 | 35 | 82.86% | 10.49% | -4.07% | 7792 |
| PH | Oct 11–Nov 30 | 50 | 46 | 86.96% | 8.73% | -9.82% | 7532 |
| SO | Oct 12–22 | 10 | 44 | 77.27% | 1.82% | -0.73% | 7460 |
| RSG | Oct 10–Dec 9 | 60 | 28 | 85.71% | 5.00% | -4.37% | 7346 |
| ORLY | Oct 7–Dec 6 | 60 | 33 | 78.79% | 9.47% | -2.32% | 7337 |
MTD takes first place with a 9992 Score, 215 points ahead of UPS. Both stand well above the rest of the ranking, although their windows do not start until October 12–13. IEX and APH are separated by only 11 points; APH has the highest win rate at 94.12% but an -8.85% average negative result. SO is the best-balanced top-ten Long on downside at -0.73%, although its average profit is modest. TPR offers +14.90% on average but remains fragile at -10.16% in negative years.
Top 10 Shorts by Score
| Stock | Window | Days | Years | Win rate | Avg profit | Avg negative | Score |
|---|---|---|---|---|---|---|---|
| BLK | Sep 19–24 | 5 | 26 | 84.62% | 2.26% | -0.73% | 7078 |
| ON | Sep 19–24 | 5 | 26 | 84.62% | 3.52% | -1.52% | 7072 |
| STLD | Sep 19–24 | 5 | 29 | 86.21% | 3.48% | -3.53% | 6812 |
| RL | Sep 19–24 | 5 | 29 | 82.76% | 2.97% | -2.00% | 6615 |
| ROK | Sep 20–25 | 5 | 44 | 77.27% | 1.95% | -0.95% | 6226 |
| A | Sep 20–25 | 5 | 26 | 80.77% | 2.48% | -1.52% | 6137 |
| CRL | Sep 18–23 | 5 | 26 | 80.77% | 1.85% | -1.57% | 5878 |
| MS | Sep 19–24 | 5 | 33 | 75.76% | 2.82% | -2.00% | 5594 |
| DHI | Sep 19–24 | 5 | 34 | 85.29% | 2.61% | -3.31% | 5520 |
| MTD | Sep 18–23 | 5 | 28 | 78.57% | 1.89% | -1.27% | 5441 |
The Short top ten is unchanged from September 8. BLK leads ON by only six points: ON delivers more average profit, while BLK has the more defensive profile at -0.73%. Every window lasts five days and begins between September 18 and 20, making these signals both compact and imminent compared with the Long leaders.
Leader comparison. MTD leads BLK by 2914 points but starts almost a month later. In the near term, the September 18–20 Short patterns are more immediate, while CB and SWKS are today’s starting signals.
Daily ranking: September 14–20
| Date | Best Long | Best Short |
|---|---|---|
| Sep 14 | CB 5401 · 60d · 33y · 78.79% · +5.65% / -4.35% | SWKS 3415 · 15d · 42y · 71.43% · +4.03% / -5.31% |
| Sep 15 | ED 2388 · 50d · 64y · 70.31% · +2.00% / -4.51% | YUM 4034 · 10d · 28y · 71.43% · +1.58% / -1.39% |
| Sep 16 | No pattern | MAS 4924 · 10d · 46y · 71.74% · +3.36% / -1.96% |
| Sep 17 | PAYX 4764 · 60d · 43y · 74.42% · +7.74% / -8.32% | FIS 4402 · 15d · 25y · 76.00% · +3.59% / -1.06% |
| Sep 18 | No pattern | CRL 5878 · 5d · 26y · 80.77% · +1.85% / -1.57% |
| Sep 19 | No pattern | BLK 7078 · 5d · 26y · 84.62% · +2.26% / -0.73% |
| Sep 20 | No pattern | ROK 6226 · 5d · 44y · 77.27% · +1.95% / -0.95% |
Reading the week
The near-term week is dominated by Shorts: BLK, ROK and CRL combine high Scores, five-day windows and contained average downside. FIS stands out for balance between +3.59% average profit and -1.06% average negative result. On the Long side, CB is today’s leader; PAYX offers higher average profit but a wider negative tail. ED has the longest sample at 64 years, yet its Score and average return are modest. The absence of qualifying Longs on September 16 and from September 18 through 20 highlights a clear weekly asymmetry.
Comparison with September 8
Long configurations rise from 254 to 278, while Shorts decline from 186 to 184. MTD overtakes UPS and raises its Score from 9019 to 9992; UPS improves to 9777. IEX advances to third, APH and SO enter the top ten, while ZBRA and CB leave. The Short top ten is unchanged. In the September 14 daily ranking, CB replaces ACGL as the best Long and rises from 4199 to 5401, while SWKS retains the Short lead at 3415.
How to read the screen
Historical recurrence does not automatically account for valuation, earnings, news, liquidity or market regime. Score, sample size, average downside and window proximity must be assessed separately.
Have a good week
Gandalf Project R&D Team
Want to build your own screens? Register for free with SeasonHunter and try the screeners used in this analysis for 14 days.
Register for freeImportant notice — Not financial advice
This information is provided solely for educational and informational purposes. Seasonal statistics are based on historical data and do not guarantee future results. This report is not an investment recommendation, solicitation or offer to buy or sell financial instruments.
