
Previsioni di volatilità settimanale su S&P 500
Il Gandalf Volatility Forecaster segnala una nuova normalizzazione della volatilità prevista. Sui 99 titoli presenti in entrambe le rilevazioni, la quota nelle classi 3–4 scende dal 67,7% al 53,5%, ridimensionando la riaccelerazione osservata nella settimana precedente.
L’analisi rappresenta un’estrazione dei 100 titoli a maggiore capitalizzazione dell’S&P 500. I risultati descrivono questo campione selezionato e non la totalità dei componenti dell’indice.
Il modello assegna a ciascun titolo la classe di volatilità più probabile su una scala da 0 a 4: molto bassa, bassa, normale, alta e molto alta. La percentuale nelle heatmap misura la confidenza relativa della classificazione scelta, non la probabilità di rialzo o ribasso del prezzo.
Contesto generale: pressione in calo, ma ancora sopra la metà del campione
Sull’intero paniere di 100 titoli, le classi 3–4 passano complessivamente da 68 a 54 componenti. La classe 3 scende da 41 a 31 titoli e la classe 4 da 27 a 23. Parallelamente, la classe 1 sale da 21 a 28 titoli e la classe 2 da 10 a 18, mentre la classe 0 passa da un titolo a nessuno.
La distribuzione si sposta quindi dalle fasce elevate verso profili bassi e normali, senza però configurare un regime pienamente disteso: più della metà del campione comparabile resta nelle classi 3–4. Si osservano 16 uscite dalle fasce alte e soltanto due ingressi.
| Classe | Definizione | 23 agosto | 30 agosto |
|---|---|---|---|
| 0 | Molto bassa | 1% | 0% |
| 1 | Bassa | 21% | 28% |
| 2 | Normale | 10% | 18% |
| 3 | Alta | 41% | 31% |
| 4 | Molto alta | 27% | 23% |
Distribuzione dei titoli per classe
L’istogramma evidenzia la contrazione delle classi 3–4 e l’ampliamento delle classi 1–2. Arancione indica la rilevazione precedente; verde quella corrente.
Molto bassa
Bassa
Normale
Alta
Molto alta
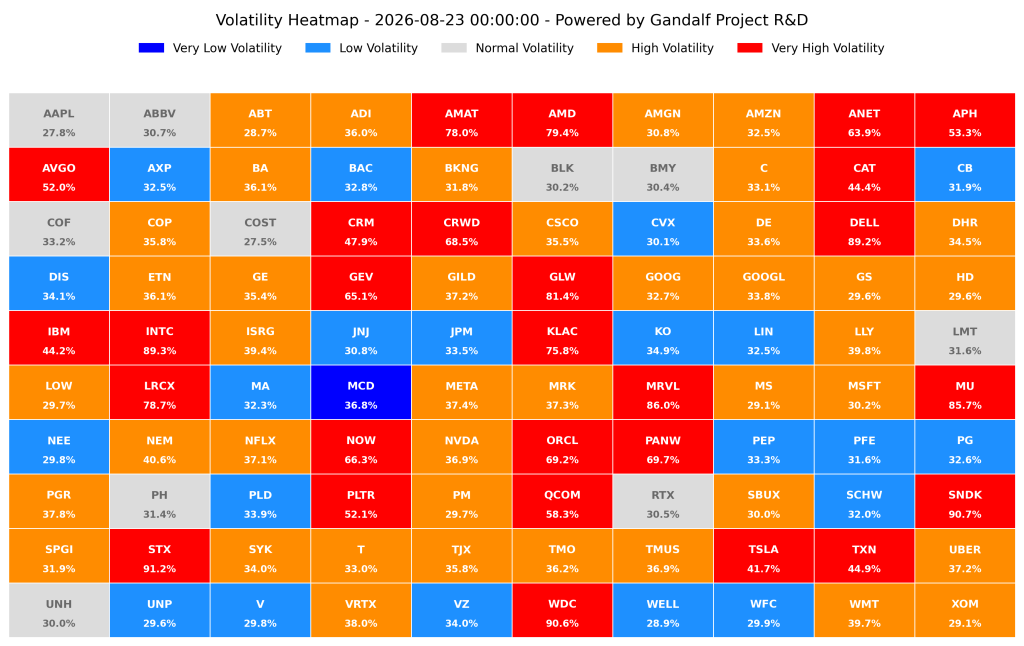
Previsione elaborata il 23 agosto 2026.
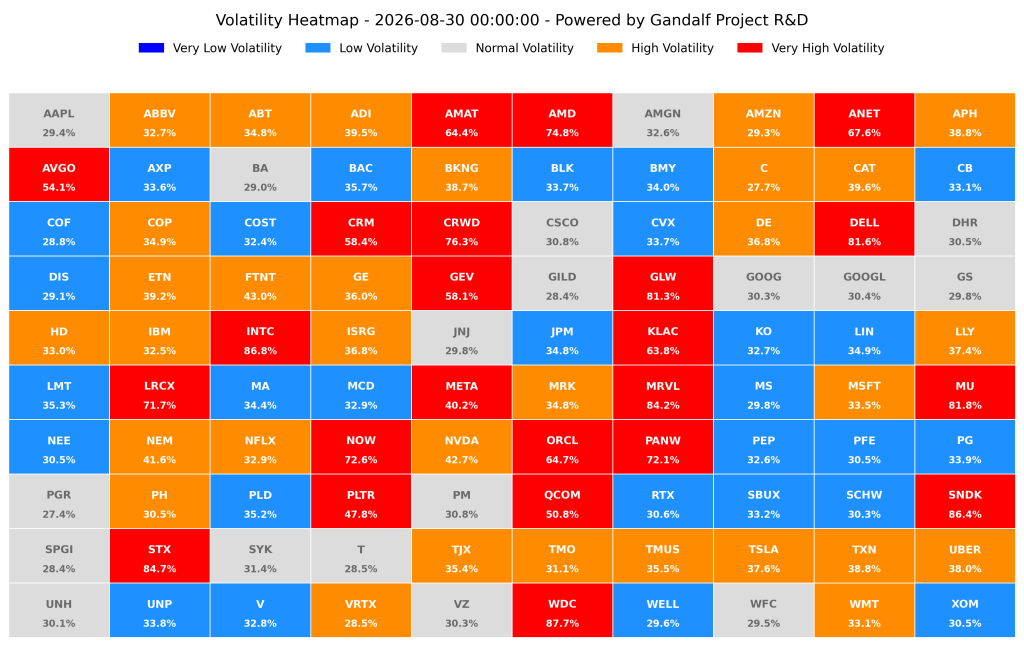
Previsione elaborata il 30 agosto 2026.
Dinamiche settoriali
Energy e Financials guidano la normalizzazione
Nell’Energy, composto da tre titoli comparabili, la quota nelle classi 3–4 scende dal 66,7% al 33,3% e la classe media da 2,33 a 1,67. Exxon Mobil passa dalla classe 3 alla 1, mentre Chevron resta in classe 1 e ConocoPhillips in classe 3.
Nei Financials, 15 titoli comparabili, la quota nelle fasce alte diminuisce dal 33,3% al 6,7% e la classe media da 1,80 a 1,40. Morgan Stanley scende dalla classe 3 alla 1; PGR, Goldman Sachs e SPGI escono dalla classe 3 con movimenti di una classe. Il settore assume così un profilo prevalentemente basso o normale.
Communication Services: forte riduzione della diffusione
Tra gli otto titoli comparabili dei Communication Services, la quota nelle classi 3–4 si dimezza dal 75,0% al 37,5%. Alphabet, Google e AT&T scendono dalla classe 3 alla 2, mentre Verizon resta in classe 2. Meta, Netflix e T-Mobile mantengono una classificazione elevata.
Health Care: arretramento dopo la riaccelerazione
Nell’Health Care, 15 titoli comparabili, la quota nelle classi 3–4 passa dal 66,7% al 46,7% e la classe media da 2,53 a 2,33. Danaher, Gilead e Amgen escono dalla classe 3; ABBV rappresenta invece uno dei due ingressi complessivi nelle fasce alte, passando dalla classe 2 alla 3.
Industrials e Consumer Staples: moderata distensione
Negli Industrials, 11 titoli comparabili, la classe media scende da 2,73 a 2,45. La quota nelle classi 3–4 resta al 63,6% grazie all’ingresso di Parker-Hannifin, che compensa le uscite di Boeing e GE. Nei Consumer Staples, sei titoli, la quota nelle fasce alte si riduce dal 33,3% al 16,7% e Philip Morris passa dalla classe 3 alla 2.
Tecnologia: il nucleo elevato resta dominante
L’Information Technology continua a mostrare il profilo più teso. Tra 29 titoli comparabili, la quota nelle classi 3–4 scende solo dal 96,6% al 93,1% e la classe media da 3,79 a 3,66. AMAT, AMD, ANET, AVGO, CRM, CRWD, DELL, GEV, GLW, INTC, KLAC, LRCX, META, MRVL, MU, NOW, ORCL, PANW, QCOM, SNDK, STX e WDC mantengono segnali molto elevati.
Le variazioni più significative
Il modello identifica tre diminuzioni di due classi e nessun aumento di pari entità:
- SBUX: classe 3 → 1; confidenza corrente 33,2%.
- MS: classe 3 → 1; confidenza corrente 29,8%.
- XOM: classe 3 → 1; confidenza corrente 30,5%.
Considerando anche i movimenti di una classe, DHR, PGR, GILD, BA, CSCO, SYK, GS, PM, SPGI, GOOGL, GOOG, T e AMGN escono dalle classi 3–4. ABBV e PH sono gli unici titoli che entrano nelle fasce alte. La composizione del paniere cambia marginalmente: FTNT entra nella rilevazione corrente, mentre LOW era presente soltanto in quella precedente; i due titoli non sono inclusi nei confronti individuali.
Indicazioni per la gestione del rischio
La riduzione della quota nelle classi 3–4 suggerisce una minore pressione aggregata rispetto alla settimana precedente. Il quadro resta tuttavia selettivo: la tecnologia conserva una concentrazione molto elevata, mentre altri settori mostrano una normalizzazione più marcata.
Le previsioni possono supportare il monitoraggio del rischio, il dimensionamento delle posizioni e la valutazione delle coperture. Devono essere integrate con liquidità, orizzonte temporale, correlazioni e obiettivi dell’investitore.
Buona settimana
Gandalf Project R&D Team
Avvertenza importante — Non è consulenza finanziaria
Le informazioni contenute nel report sono fornite esclusivamente a scopo educativo e informativo. Non costituiscono una sollecitazione al pubblico risparmio, una raccomandazione di investimento o un’offerta di acquisto o vendita di strumenti finanziari. Gandalf Project non si assume responsabilità per decisioni di investimento prese sulla base del report; gli investitori devono svolgere valutazioni autonome e, se necessario, consultare un consulente finanziario qualificato.
Weekly Volatility Forecast for the S&P 500
The Gandalf Volatility Forecaster points to a renewed normalisation in forecast volatility. Among the 99 stocks included in both model runs, the share assigned to classes 3–4 falls from 67.7% to 53.5%, partly reversing the reacceleration observed one week earlier.
The analysis is based on a selection of the 100 largest S&P 500 constituents by market capitalisation. The results describe this selected sample rather than the index’s full constituent universe.
The model assigns each stock its most likely volatility class on a scale from 0 to 4: very low, low, normal, high and very high. The percentage displayed in the heatmaps measures relative confidence in the selected classification; it is not the probability of a price increase or decrease.
General context: pressure eases but remains above half of the sample
Across the full 100-stock universe, classes 3–4 decline from a combined 68 to 54 constituents. Class 3 falls from 41 to 31 stocks and class 4 from 27 to 23. At the same time, class 1 rises from 21 to 28 stocks and class 2 from 10 to 18, while class 0 falls from one stock to none.
The distribution therefore shifts from the upper bands towards low and normal profiles, without indicating a fully relaxed regime: more than half of the comparable sample remains in classes 3–4. Sixteen stocks leave the upper bands and only two enter.
| Class | Definition | August 23 | August 30 |
|---|---|---|---|
| 0 | Very low | 1% | 0% |
| 1 | Low | 21% | 28% |
| 2 | Normal | 10% | 18% |
| 3 | High | 41% | 31% |
| 4 | Very high | 27% | 23% |
Distribution of stocks by class
The histogram highlights the contraction in classes 3–4 and the expansion of classes 1–2. Orange represents the previous run and green the current run.
Very low
Low
Normal
High
Very high
Forecast generated on August 23, 2026.
Forecast generated on August 30, 2026.
Sector dynamics
Energy and Financials lead the normalisation
Among three comparable Energy stocks, the share in classes 3–4 falls from 66.7% to 33.3% and the average class from 2.33 to 1.67. Exxon Mobil moves from class 3 to class 1, while Chevron remains in class 1 and ConocoPhillips in class 3.
Among 15 comparable Financials, the upper-band share declines from 33.3% to 6.7% and the average class from 1.80 to 1.40. Morgan Stanley moves from class 3 to class 1; PGR, Goldman Sachs and SPGI leave class 3 through one-class moves. The sector therefore adopts a predominantly low or normal profile.
Communication Services: a sharp reduction in breadth
Among eight comparable Communication Services stocks, the share in classes 3–4 halves from 75.0% to 37.5%. Alphabet, Google and AT&T move from class 3 to class 2, while Verizon remains in class 2. Meta, Netflix and T-Mobile retain elevated classifications.
Health Care: retreat after the reacceleration
Among 15 comparable Health Care stocks, the share in classes 3–4 falls from 66.7% to 46.7% and the average class from 2.53 to 2.33. Danaher, Gilead and Amgen leave class 3; ABBV is instead one of only two entries into the upper bands, moving from class 2 to class 3.
Industrials and Consumer Staples: moderate easing
Among 11 comparable Industrials, the average class declines from 2.73 to 2.45. The share in classes 3–4 remains at 63.6% because Parker-Hannifin’s entry offsets the exits of Boeing and GE. Among six Consumer Staples stocks, the upper-band share falls from 33.3% to 16.7%, with Philip Morris moving from class 3 to class 2.
Technology: the elevated core remains dominant
Information Technology continues to display the most stressed profile. Among 29 comparable stocks, the share in classes 3–4 declines only from 96.6% to 93.1% and the average class from 3.79 to 3.66. AMAT, AMD, ANET, AVGO, CRM, CRWD, DELL, GEV, GLW, INTC, KLAC, LRCX, META, MRVL, MU, NOW, ORCL, PANW, QCOM, SNDK, STX and WDC retain very-high signals.
Most significant changes
The model identifies three two-class decreases and no increase of the same magnitude:
- SBUX: class 3 → 1; current confidence 33.2%.
- MS: class 3 → 1; current confidence 29.8%.
- XOM: class 3 → 1; current confidence 30.5%.
When one-class moves are included, DHR, PGR, GILD, BA, CSCO, SYK, GS, PM, SPGI, GOOGL, GOOG, T and AMGN leave classes 3–4. ABBV and PH are the only stocks entering the upper bands. The universe composition changes marginally: FTNT enters the current run, while LOW appeared only in the previous one; neither stock is included in individual week-over-week comparisons.
Risk-management implications
The decline in the share of classes 3–4 suggests lower aggregate pressure than one week earlier. The picture remains selective, however: Technology retains a very high concentration, while other sectors show more pronounced normalisation.
The forecasts may support risk monitoring, position-sizing reviews and hedging assessments. They should be considered together with liquidity, investment horizon, correlations and the investor’s objectives.
Have a good week
Gandalf Project R&D Team
Important notice — Not financial advice
The information contained in this report is provided solely for educational and informational purposes. It does not constitute a solicitation of public savings, an investment recommendation, or an offer to buy or sell financial instruments. Gandalf Project accepts no responsibility for investment decisions made on the basis of this report. Investors should conduct their own assessments and, where appropriate, consult a qualified financial adviser.
