
Le migliori stagionalità in partenza: 24 agosto 2026
Scopri direttamente le stagionalità del mercato. Registrati gratuitamente su SeasonHunter e utilizza gli screener completi per 14 giorni.
Prova SeasonHunter gratuitamente
SeasonHunter analizza migliaia di strumenti finanziari alla ricerca di pattern stagionali ricorrenti.
Lo screening restituisce 208 Long e 185 Short. Entrambe le tabelle sono state verificate con ordinamento globale SCORE ▼.
Top 10 Long per Score
| Titolo | Finestra | Anni | Successo | Profitto medio | Media negativa | Score |
|---|---|---|---|---|---|---|
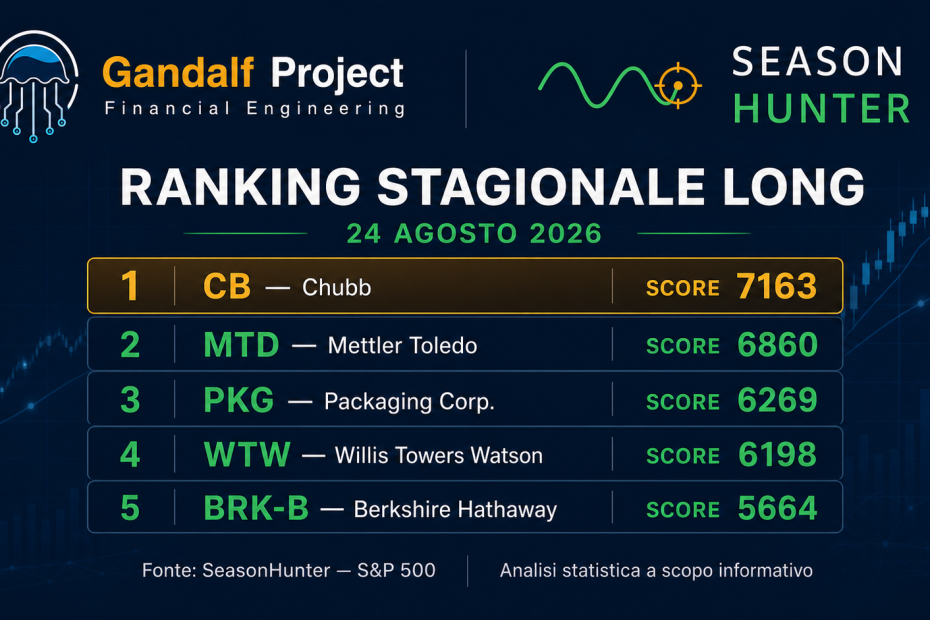
| CB · Chubb | 31 ago–30 ott | 33 | 78,79% | 6,39% | -3,48% | 7163 |
| MTD · Mettler Toledo | 23 set–7 nov | 28 | 82,14% | 8,76% | -7,03% | 6860 |
| PKG · Packaging Corp. | 24 ago–13 set | 26 | 84,62% | 3,26% | -3,22% | 6269 |
| WTW · Willis Towers Watson | 25 ago–19 set | 25 | 80,00% | 3,06% | -2,65% | 6198 |
| BRK-B · Berkshire Hathaway | 10 set–9 nov | 30 | 80,00% | 3,42% | -2,65% | 5664 |
| ALL · Allstate | 9–19 set | 33 | 75,76% | 2,32% | -1,70% | 5640 |
| ADP | 17 set–16 nov | 46 | 78,26% | 6,93% | -7,46% | 5426 |
| NVDA · Nvidia | 13 set–7 nov | 27 | 81,48% | 10,83% | -14,15% | 5344 |
| RCL · Royal Caribbean | 10–15 set | 33 | 81,82% | 2,32% | -2,84% | 5246 |
| MDLZ · Mondelez | 11–16 set | 25 | 76,00% | 0,72% | -0,76% | 5241 |
MTD sale al secondo posto
CB conserva la leadership a 7163. MTD passa dal quarto al secondo posto grazie alla nuova finestra 23 settembre–7 novembre: Score 6860, profitto medio 8,76% e perdita media negativa -7,03%. Rispetto al pattern precedente il rischio migliora, ma resta più ampio di PKG e WTW. NTAP esce perché la finestra è trascorsa; MDLZ entra decimo con rendimento modesto ma media negativa contenuta a -0,76%. NVDA resta il pattern più fragile della top ten: profitto medio 10,83%, ma media negativa -14,15%.
Top 10 Short per Score
| Titolo | Finestra | Anni | Successo | Profitto medio | Media negativa | Score |
|---|---|---|---|---|---|---|
| BLK · BlackRock | 19–24 set | 26 | 84,62% | 2,26% | -0,73% | 7078 |
| ON · ON Semiconductor | 19–24 set | 26 | 84,62% | 3,52% | -1,52% | 7072 |
| STLD · Steel Dynamics | 19–24 set | 29 | 86,21% | 3,48% | -3,53% | 6812 |
| RL · Ralph Lauren | 19–24 set | 29 | 82,76% | 2,97% | -2,00% | 6615 |
| ROK · Rockwell Automation | 20–25 set | 44 | 77,27% | 1,95% | -0,95% | 6226 |
| A · Agilent | 20–25 set | 26 | 80,77% | 2,48% | -1,52% | 6137 |
| CRL | 18–23 set | 26 | 80,77% | 1,85% | -1,57% | 5878 |
| MS · Morgan Stanley | 19–24 set | 33 | 75,76% | 2,82% | -2,00% | 5594 |
| DHI · D.R. Horton | 19–24 set | 34 | 85,29% | 2,61% | -3,31% | 5520 |
| MTD | 18–23 set | 28 | 78,57% | 1,89% | -1,27% | 5441 |
BLK e ON restano quasi appaiati
La top ten Short non cambia rispetto al 21 agosto. BLK precede ON di appena 6 punti e mostra il profilo più equilibrato, con media negativa -0,73%. ON offre più profitto medio, mentre STLD ha il win rate più alto ma una coda negativa più severa. Tutti i primi dieci hanno durata di cinque giorni: Score elevati, ma finestre concentrate fra il 18 e il 25 settembre.
Leader a confronto. CB 7163 contro BLK 7078: solo 85 punti di distanza. CB parte il 31 agosto; BLK il 19 settembre.
Ranking giornaliero: 24–30 agosto
| Data | Migliori Long | Migliori Short |
|---|---|---|
| 24 agosto | PKG 6269 · AVB 4051 · SPG 3548 | LH 3123 |
| 25 agosto | WTW 6198 · GILD 4646 · PSA 3359 | RSG 2758 · CPB 1673 |
| 26 agosto | GPN 4945 · ALGN 3683 · EW 3389 | DLTR 3165 |
| 27 agosto | FRT 3853 · LII 3718 · IT 3699 | Nessun pattern |
| 28 agosto | COR 3740 · CSGP 2017 · WMT 1382 | Nessun pattern |
| 29 agosto | Nessun pattern | AME 2411 |
| 30 agosto | TKO 2281 | Nessun pattern |
Lettura della settimana
PKG e WTW dominano i segnali ravvicinati con Score sopra 6100 e win rate almeno dell’80%. GPN è il pattern breve più equilibrato: cinque giorni, 25 osservazioni, 76% di successi, profitto medio 1,23% e media negativa -1,27%. ALGN offre più rendimento (5,10%), ma con appena 25 osservazioni e media negativa -4,61%.
Gli Short settimanali sono più deboli. LH offre 4,31% medio ma su 50 giorni e con -5,69% nelle annate negative. DLTR è breve e prossimo, ma mostra una coda negativa di -3,90%. CPB è più difensivo (-1,88%) ma ha Score 1673. Il 29 e 30 agosto presentano un solo segnale ciascuno, rispettivamente AME Short e TKO Long.
Confronto con il 21 agosto
I Long salgono da 185 a 208: MTD entra secondo, PKG e WTW scendono di una posizione, NTAP esce e MDLZ entra decimo. Gli Short crescono da 174 a 185 ma mantengono invariata la top ten. Nel ranking giornaliero RSG passa al 25 agosto e scende da 3100 a 2758; ALGN entra fra i leader del 26.
Come leggere lo screening
Le statistiche descrivono ricorrenze storiche e non incorporano automaticamente valutazioni, utili, notizie, liquidità o regime di mercato. La selezione fra molte combinazioni aumenta il rischio di ottimizzazione sul passato. Score, robustezza e prossimità della finestra vanno valutati separatamente.
Buona settimana
Gandalf Project R&D Team
Vuoi creare i tuoi screening? Registrati gratuitamente su SeasonHunter e prova per 14 giorni gli screener utilizzati per questa analisi.
Registrati gratuitamenteAvvertenza importante — Non è consulenza finanziaria
Le informazioni sono fornite esclusivamente a scopo educativo e informativo. Le statistiche stagionali si basano su dati storici e non garantiscono risultati futuri. Il report non costituisce una raccomandazione, sollecitazione od offerta di acquisto o vendita di strumenti finanziari.
Best Upcoming Seasonal Patterns: August 24, 2026
Explore market seasonality directly. Register for free with SeasonHunter and use the complete screeners for 14 days.
Try SeasonHunter for freeSeasonHunter screens thousands of financial instruments for recurring seasonal patterns.
The screen returns 208 Long and 185 Short configurations. Both tables were verified in global descending SCORE order.
Top 10 Longs by Score
| Stock | Window | Years | Win rate | Avg profit | Avg negative | Score |
|---|---|---|---|---|---|---|
| CB | Aug 31–Oct 30 | 33 | 78.79% | 6.39% | -3.48% | 7163 |
| MTD | Sep 23–Nov 7 | 28 | 82.14% | 8.76% | -7.03% | 6860 |
| PKG | Aug 24–Sep 13 | 26 | 84.62% | 3.26% | -3.22% | 6269 |
| WTW | Aug 25–Sep 19 | 25 | 80.00% | 3.06% | -2.65% | 6198 |
| BRK-B | Sep 10–Nov 9 | 30 | 80.00% | 3.42% | -2.65% | 5664 |
| ALL | Sep 9–19 | 33 | 75.76% | 2.32% | -1.70% | 5640 |
| ADP | Sep 17–Nov 16 | 46 | 78.26% | 6.93% | -7.46% | 5426 |
| NVDA | Sep 13–Nov 7 | 27 | 81.48% | 10.83% | -14.15% | 5344 |
| RCL | Sep 10–15 | 33 | 81.82% | 2.32% | -2.84% | 5246 |
| MDLZ | Sep 11–16 | 25 | 76.00% | 0.72% | -0.76% | 5241 |
CB remains first at 7163. MTD rises to second through a new September 23–November 7 window: 6860 Score, 8.76% average profit and a -7.03% average negative result. NTAP leaves because its window has passed; MDLZ enters tenth with modest profit but a defensive -0.76% average negative result. NVDA remains fragile despite its high average profit because negative years average -14.15%.
Top 10 Shorts by Score
| Stock | Window | Years | Win rate | Avg profit | Avg negative | Score |
|---|---|---|---|---|---|---|
| BLK | Sep 19–24 | 26 | 84.62% | 2.26% | -0.73% | 7078 |
| ON | Sep 19–24 | 26 | 84.62% | 3.52% | -1.52% | 7072 |
| STLD | Sep 19–24 | 29 | 86.21% | 3.48% | -3.53% | 6812 |
| RL | Sep 19–24 | 29 | 82.76% | 2.97% | -2.00% | 6615 |
| ROK | Sep 20–25 | 44 | 77.27% | 1.95% | -0.95% | 6226 |
| A | Sep 20–25 | 26 | 80.77% | 2.48% | -1.52% | 6137 |
| CRL | Sep 18–23 | 26 | 80.77% | 1.85% | -1.57% | 5878 |
| MS | Sep 19–24 | 33 | 75.76% | 2.82% | -2.00% | 5594 |
| DHI | Sep 19–24 | 34 | 85.29% | 2.61% | -3.31% | 5520 |
| MTD | Sep 18–23 | 28 | 78.57% | 1.89% | -1.27% | 5441 |
The Short top ten is unchanged. BLK leads ON by only six points and has the most balanced downside profile at -0.73%. ON offers more average profit, while STLD has the highest win rate but a harsher negative tail. Every top-ten Short lasts five days and starts between September 18 and 25.
Leader comparison. CB 7163 versus BLK 7078: only 85 points apart. CB starts August 31; BLK starts September 19.
Daily ranking: August 24–30
| Date | Best Longs | Best Shorts |
|---|---|---|
| Aug 24 | PKG 6269 · AVB 4051 · SPG 3548 | LH 3123 |
| Aug 25 | WTW 6198 · GILD 4646 · PSA 3359 | RSG 2758 · CPB 1673 |
| Aug 26 | GPN 4945 · ALGN 3683 · EW 3389 | DLTR 3165 |
| Aug 27 | FRT 3853 · LII 3718 · IT 3699 | No pattern |
| Aug 28 | COR 3740 · CSGP 2017 · WMT 1382 | No pattern |
| Aug 29 | No pattern | AME 2411 |
| Aug 30 | TKO 2281 | No pattern |
PKG and WTW dominate near-term signals above 6100 with at least 80% win rates. GPN is the best short-window balance: five days, 25 observations, 76% wins and a -1.27% average negative year. Weekly Shorts are weaker: LH has 4.31% average profit but lasts 50 days and averages -5.69% in negative years; DLTR is shorter but its downside tail is -3.90%.
Comparison with August 21
Longs rise from 185 to 208: MTD enters second, PKG and WTW move down one place, NTAP exits and MDLZ enters tenth. Shorts rise from 174 to 185 while their top ten remains unchanged. RSG shifts to August 25 and falls from 3100 to 2758; ALGN enters the August 26 leaders.
How to read the screen
Historical recurrence does not automatically account for valuation, earnings, news, liquidity or market regime. Testing many date and duration combinations also creates optimisation risk. Score, robustness and proximity must be assessed separately.
Have a good week
Gandalf Project R&D Team
Want to build your own screens? Register for free with SeasonHunter and try the screeners used in this analysis for 14 days.
Register for freeImportant notice — Not financial advice
This information is provided solely for educational and informational purposes. Seasonal statistics are based on historical data and do not guarantee future results. This report is not an investment recommendation, solicitation or offer to buy or sell financial instruments.
