

Once again this week, the proprietary models (used by our research and development team at Gandalf Project) have predicted the volatility levels of the 100 largest-cap assets in the S&P 500 for the upcoming week (from Monday, January 13, to Friday, January 17, 2025):
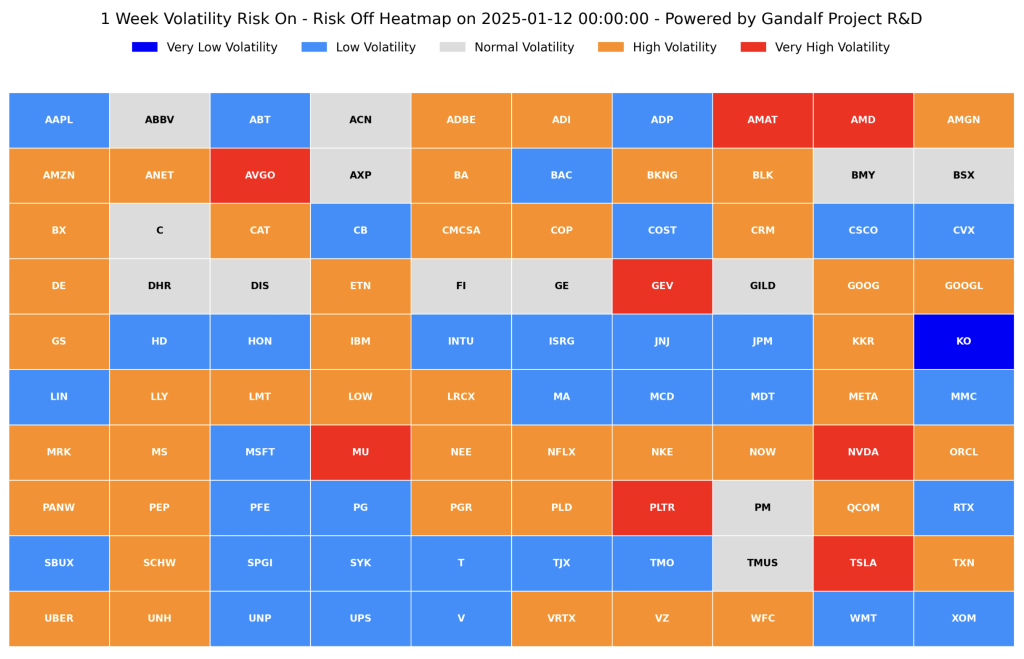
In a week’s time, we will know the accuracy of this prediction.
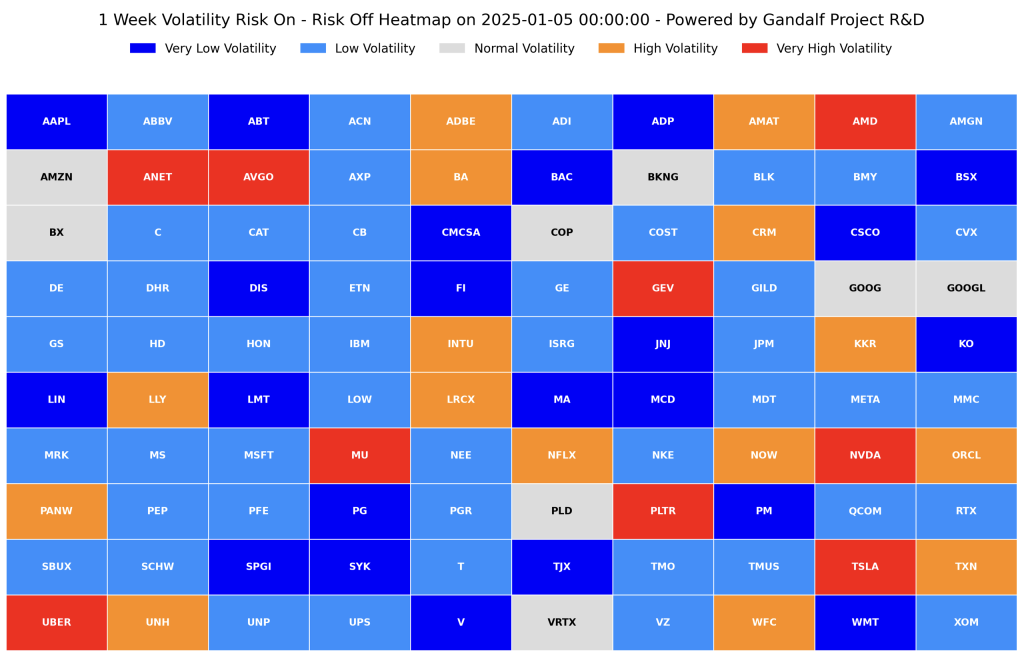
What can be verified now, however, is the accuracy of last week’s predictions (issued on January 5, 2025, and valid from Monday, January 6, to Friday, January 10, 2025). Below is the prediction table, which was made public last week.
In the next table, we present what actually materialized following the market close on Friday, January 10, 2025.
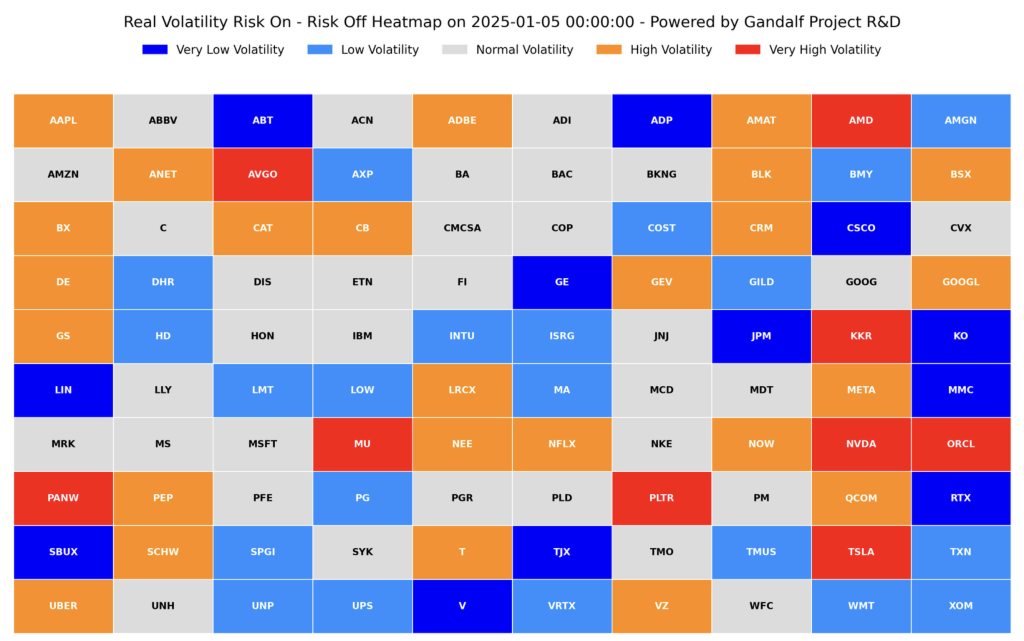
As much as it is possible to make an initial qualitative verification by comparing the color levels, we wish to present some statistics below. Let’s begin by creating the following columns:
- ticker: the ticker corresponding to each of the 100 analyzed assets.
- y_real: the correct class as observed for the actual volatility at the end of the week.
- prediction: the prediction from our models.
- deltas: the arithmetic difference between y_real and prediction, representing the magnitude of the error made.
- prediction_color: the color associated with each prediction (“cold” for classes 0 and 1, “warm” for classes 3 and 4).
- real_color: the color associated with each actual volatility value (“cold” for classes 0 and 1, “warm” for classes 3 and 4).
- color_error: set to 1 if the prediction and the actual value have inverted colors (cold-warm or warm-cold).
- hard_errors: cases where the class error exceeds 1.
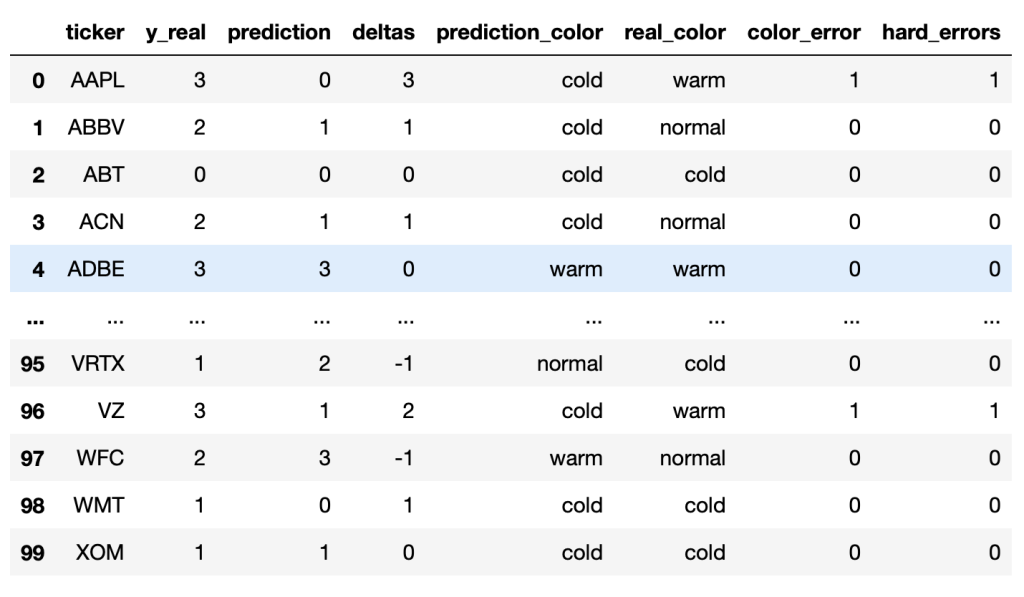
36% of the assets were predicted correctly, meaning the exact percentile class of volatility was accurately forecasted. To put the significance of this prediction into perspective, consider that if we were to roll a five-sided die each time, there would only be a 20% chance of guessing the correct class.
Below are the tickers for which the expected volatility was correctly identified.
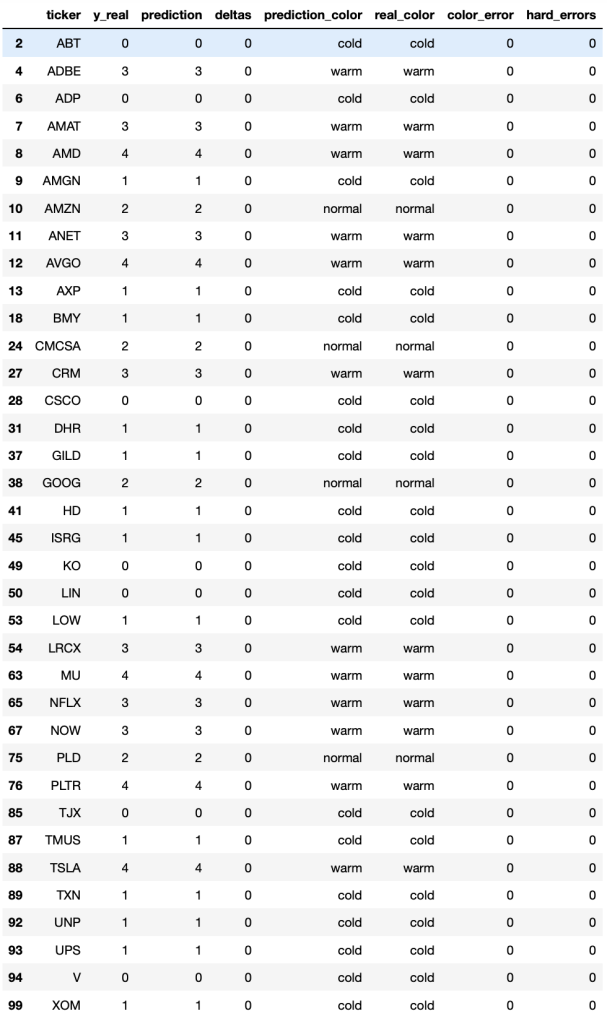
For convenience, we also provide the list of these tickers:
['ABT', 'ADBE', 'ADP', 'AMAT', 'AMD', 'AMGN', 'AMZN', 'ANET',
 'AVGO', 'AXP', 'BMY', 'CMCSA', 'CRM', 'CSCO', 'DHR', 'GILD',
 'GOOG', 'HD', 'ISRG', 'KO', 'LIN', 'LOW', 'LRCX', 'MU', 'NFLX',
 'NOW', 'PLD', 'PLTR', 'TJX', 'TMUS', 'TSLA', 'TXN', 'UNP', 'UPS',
 'V', 'XOM']
While the 36% accuracy is certainly encouraging compared to the 20% expected from random predictions, we must carefully analyze the incorrect predictions for the remaining 64 assets. A one-class error will not be considered a ‘hard_error’ or ‘severe error,’ while all tickers classified with a class difference greater than one will represent significant errors. In our case, only 20 of the 64 misclassified tickers constitute severe errors (details below).
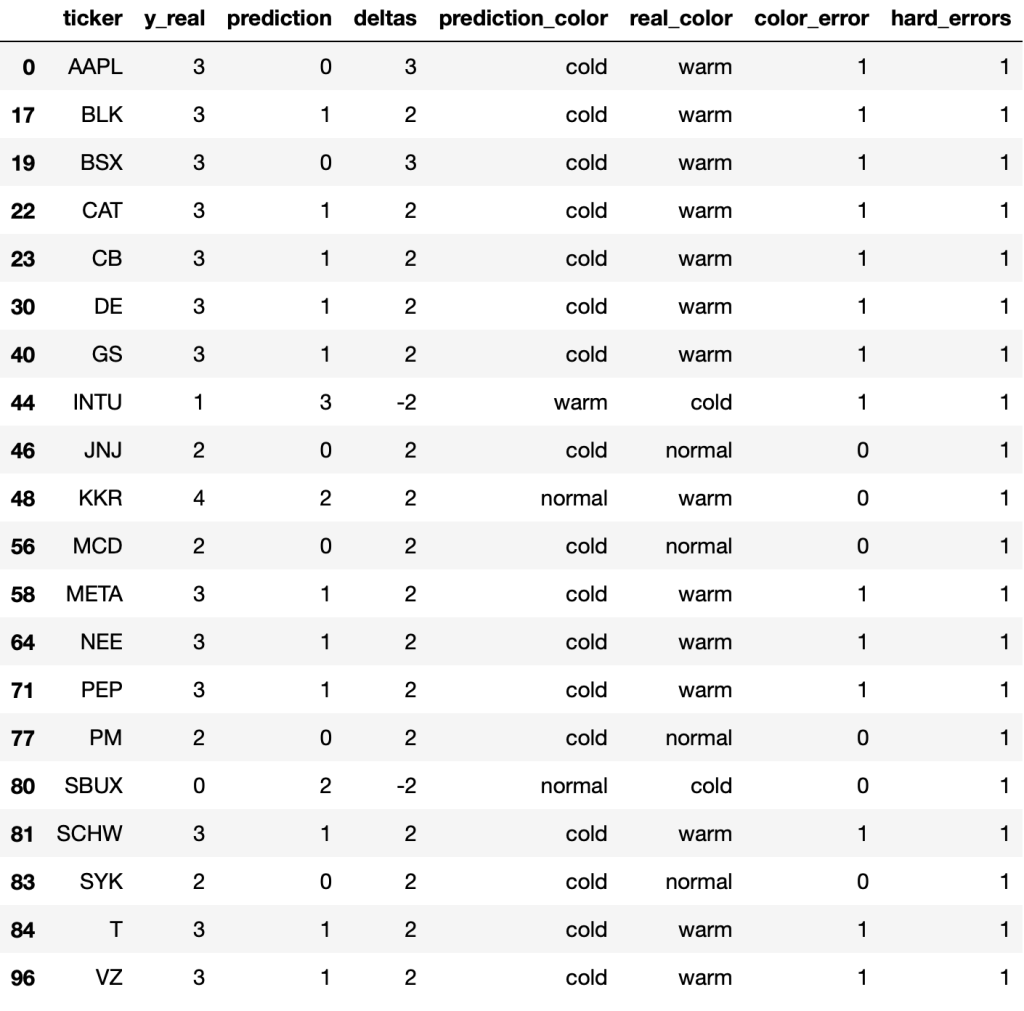
Among these, AAPL and BSX show a delta of 3.
In this brief article, we have attempted to delve a little deeper into the weekly heatmaps produced by the volatility classifiers applied to the 100 largest-cap stocks in the S&P 500. In upcoming articles, we will explore these details even further. Remember, to receive this information weekly (currently free and soon to be part of a more comprehensive service), simply leave your email at info@gandalfproject.com.
Have a great week!
Giovanni Trombetta
Founder – Head of R&D
Gandalf Project
